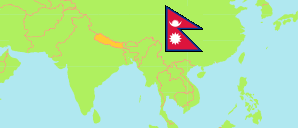
Bhojpur
District in Nepal
Contents: Subdivision
The population development in Bhojpur as well as related information and services (Wikipedia, Google, images).
| Name | Status | Transcription | Native | Population Census 2001-05-28 | Population Census 2011-06-22 | Population Census 2021-11-25 | |
|---|---|---|---|---|---|---|---|
| Bhojpur | District | Bhōjapura | भोजपुर जिल्ला | 203,018 | 182,459 | 157,923 | |
| Aamchok | Rural Municipality | Āmacōka | आमचोक गाउँपालिका | 20,753 | 18,777 | 14,968 | → |
| Arun | Rural Municipality | Aruṇa | अरुण गाउँपालिका | 19,574 | 17,768 | 14,591 | → |
| Bhojpur | Municipality | Bhōjapura | भोजपुर नगरपालिका | ... | 28,107 | 26,007 | → |
| Hatuwagadhi | Rural Municipality | Hatuvāgaḍhī | हतुवागढी गाउँपालिका | 24,252 | 20,543 | 16,175 | → |
| Pauwadungma | Rural Municipality | Pauvāduṅamā | पौवादुङमा गाउँपालिका | 17,976 | 15,414 | 12,107 | → |
| Ramprasad Rai | Rural Municipality | Rāmaprasāda Rāī | रामप्रसाद राई गाउँपालिका | 21,493 | 18,894 | 15,673 | → |
| Salpasilichho | Rural Municipality | Sālpāsilichō | साल्पासिलिछो गाउँपालिका | 13,870 | 13,111 | 12,284 | → |
| Shadananda | Municipality | Ṣaḍānanda | षडानन्द नगरपालिका | 33,560 | 31,612 | 29,342 | → |
| Tyamkemaiyung | Rural Municipality | Ṭēmkēmaiyuṅa | टेम्केमैयुङ गाउँपालिका | 22,027 | 18,233 | 15,464 | → |
| Nepal | Federal Republic | Nēpāla | नेपाल | 23,151,423 | 26,494,504 | 29,164,578 |
Source: Central Bureau of Statistics Nepal (web).
Explanation: The local units became operational in May 2017. The 2021 population of local units exclude institional population.
Further information about the population structure:
| Gender (C 2021) | |
|---|---|
| Males | 78,211 |
| Females | 79,712 |
| Age Groups (C 2021) | |
|---|---|
| 0-14 years | 42,269 |
| 15-64 years | 101,656 |
| 65+ years | 13,998 |
| Age Distribution (C 2021) | |
|---|---|
| 90+ years | 323 |
| 80-89 years | 2,134 |
| 70-79 years | 6,550 |
| 60-69 years | 11,899 |
| 50-59 years | 16,440 |
| 40-49 years | 16,279 |
| 30-39 years | 19,861 |
| 20-29 years | 26,067 |
| 10-19 years | 31,702 |
| 0-9 years | 26,668 |
| Citizenhip (C 2021) | |
|---|---|
| Nepal | 157,892 |
| India | 28 |
| Other Citizenship | 3 |
| Place of Birth (C 2021) | |
|---|---|
| Same local unit | 132,188 |
| Other local unit in same district | 13,365 |
| Other district | 11,853 |
| Other country | 478 |
| Literacy (A5+) (C 2021) | |
|---|---|
| Yes | 114,914 |
| Only reading | 886 |
| No | 29,890 |