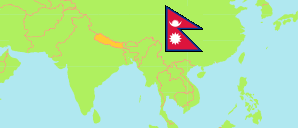
Taplejung
District in Nepal
Contents: Subdivision
The population development in Taplejung as well as related information and services (Wikipedia, Google, images).
| Name | Status | Transcription | Native | Population Census 2001-05-28 | Population Census 2011-06-22 | Population Census 2021-11-25 | |
|---|---|---|---|---|---|---|---|
| Taplejung | District | Tāplējuṅa | ताप्लेजुङ जिल्ला | 134,698 | 127,461 | 120,590 | |
| Aathrai Tribeni | Rural Municipality | Āṭharāī Trivēṇī | आठराई त्रिवेणी गाउँपालिका | 15,978 | 13,784 | 12,296 | → |
| Maiwakhola | Rural Municipality | Maivākhōlā | मैवाखोला गाउँपालिका | 12,485 | 11,094 | 10,213 | → |
| Meringden | Rural Municipality | Mēriṅadēna | मेरिङदेन गाउँपालिका | ... | 13,284 | 11,838 | → |
| Mikwakhola | Rural Municipality | Mikvākhōlā | मिक्वाखोला गाउँपालिका | 9,561 | 9,160 | 7,964 | → |
| Pathibhara Yangwarak | Rural Municipality | Pāthībharā Yāṅavaraka | पाथीभरा याङवरक गाउँपालिका | 15,509 | 13,591 | 11,806 | → |
| Phaktanglung | Rural Municipality | Phaktāṅaluṅa | फक्ताङलुङ गाउँपालिका | 12,938 | 12,017 | 11,791 | → |
| Phungling | Municipality | Phuṅaliṅa | फुङलिङ नगरपालिका | 23,651 | 26,626 | 28,449 | → |
| Sidingwa | Rural Municipality | Sidiṅvā | सिदिङ्वा गाउँपालिका | 13,477 | 12,099 | 10,979 | → |
| Sirijangha | Rural Municipality | Sirījaṅghā | सिरीजङ्घा गाउँपालिका | 17,134 | 15,806 | 14,114 | → |
| Nepal | Federal Republic | Nēpāla | नेपाल | 23,151,423 | 26,494,504 | 29,164,578 |
Source: Central Bureau of Statistics Nepal (web).
Explanation: The local units became operational in May 2017. The 2021 population of local units exclude institional population.
Further information about the population structure:
| Gender (C 2021) | |
|---|---|
| Males | 60,773 |
| Females | 59,817 |
| Age Groups (C 2021) | |
|---|---|
| 0-14 years | 33,529 |
| 15-64 years | 78,608 |
| 65+ years | 8,453 |
| Age Distribution (C 2021) | |
|---|---|
| 90+ years | 156 |
| 80-89 years | 1,168 |
| 70-79 years | 3,889 |
| 60-69 years | 7,628 |
| 50-59 years | 11,184 |
| 40-49 years | 11,941 |
| 30-39 years | 15,571 |
| 20-29 years | 22,444 |
| 10-19 years | 24,673 |
| 0-9 years | 21,936 |
| Citizenhip (C 2021) | |
|---|---|
| Nepal | 120,381 |
| India | 199 |
| Other Citizenship | 10 |
| Place of Birth (C 2021) | |
|---|---|
| Same local unit | 97,430 |
| Other local unit in same district | 15,673 |
| Other district | 6,799 |
| Other country | 653 |
| Literacy (A5+) (C 2021) | |
|---|---|
| Yes | 90,733 |
| Only reading | 341 |
| No | 19,295 |