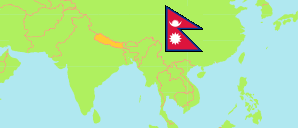
Gandaki
Province in Nepal
Contents: Subdivision
The population development in Gandaki as well as related information and services (Wikipedia, Google, images).
| Name | Status | Transcription | Native | Population Census 1981-06-22 | Population Census 1991-06-22 | Population Census 2001-05-28 | Population Census 2011-06-22 | Population Census 2021-11-25 | |
|---|---|---|---|---|---|---|---|---|---|
| Gandaki | Province | Gaṇḍakī | गण्डकी प्रदेश | 1,710,574 | 1,968,233 | 2,316,702 | 2,403,757 | 2,466,427 | |
| Baglung | District | Bāgaluṅa | बागलुङ जिल्ला | 215,228 | 232,486 | 268,937 | 268,613 | 249,211 | → |
| Gorkha | District | Gōrakhā | गोरखा जिल्ला | 231,294 | 252,524 | 288,134 | 271,061 | 251,027 | → |
| Kaski | District | Kāskī | कास्की जिल्ला | 221,272 | 292,945 | 380,527 | 492,098 | 600,051 | → |
| Lamjung | District | Lamajuṅa | लमजुङ जिल्ला | 152,720 | 153,697 | 177,149 | 167,724 | 155,852 | → |
| Manang | District | Manāṅa | मनाङ जिल्ला | 7,021 | 5,363 | 9,587 | 6,538 | 5,658 | → |
| Mustang | District | Mustāṅa | मुस्ताङ जिल्ला | 12,930 | 14,292 | 14,981 | 13,452 | 14,452 | → |
| Myagdi | District | Myāgdī | म्याग्दी जिल्ला | 96,904 | 100,552 | 114,447 | 113,641 | 107,033 | → |
| Nawalpur [Nawalparasi East] | District | Navalapura | नवलपुर जिल्ला | 149,543 | 211,228 | 272,557 | 311,604 | 378,079 | → |
| Parbat | District | Parvata | पर्वत जिल्ला | 128,400 | 143,547 | 157,826 | 146,590 | 130,887 | → |
| Syangja | District | Syāṅjā | स्याङ्जा जिल्ला | 271,824 | 293,526 | 317,320 | 289,148 | 253,024 | → |
| Tanahun | District | Tanahũ | तनहुँ जिल्ला | 223,438 | 268,073 | 315,237 | 323,288 | 321,153 | → |
| Nepal | Federal Republic | Nēpāla | नेपाल | 15,022,839 | 18,491,097 | 23,151,423 | 26,494,504 | 29,164,578 |
Source: Central Bureau of Statistics Nepal (web).
Further information about the population structure:
| Gender (C 2021) | |
|---|---|
| Males | 1,170,833 |
| Females | 1,295,594 |
| Age Groups (C 2021) | |
|---|---|
| 0-14 years | 588,768 |
| 15-64 years | 1,650,742 |
| 65+ years | 226,917 |
| Age Distribution (C 2021) | |
|---|---|
| 90+ years | 6,558 |
| 80-89 years | 33,301 |
| 70-79 years | 105,018 |
| 60-69 years | 184,230 |
| 50-59 years | 245,045 |
| 40-49 years | 282,426 |
| 30-39 years | 354,957 |
| 20-29 years | 429,879 |
| 10-19 years | 454,060 |
| 0-9 years | 370,953 |
| Citizenhip (C 2021) | |
|---|---|
| Nepal | 2,453,472 |
| India | 12,321 |
| Other Citizenship | 612 |
| Place of Birth (C 2021) | |
|---|---|
| Same local unit | 1,623,644 |
| Other local unit in same district | 282,306 |
| Other district | 515,484 |
| Other country | 42,015 |
| Literacy (A5+) (C 2021) | |
|---|---|
| Yes | 1,875,910 |
| Only reading | 18,252 |
| No | 399,642 |