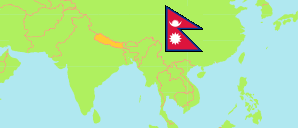
Madhesh
Province in Nepal
Contents: Subdivision
The population development in Madhesh as well as related information and services (Wikipedia, Google, images).
| Name | Status | Transcription | Native | Population Census 1981-06-22 | Population Census 1991-06-22 | Population Census 2001-05-28 | Population Census 2011-06-22 | Population Census 2021-11-25 | |
|---|---|---|---|---|---|---|---|---|---|
| Madhesh [Province No. 2] | Province | Madheśa | मधेश प्रदेश | 2,882,623 | 3,605,277 | 4,604,713 | 5,404,145 | 6,114,600 | |
| Bara | District | Bārā | बारा जिल्ला | 318,957 | 415,718 | 559,135 | 687,708 | 763,137 | → |
| Dhanusa | District | Dhanuṣā | धनुषा जिल्ला | 432,569 | 543,672 | 671,364 | 754,777 | 867,747 | → |
| Mahottari | District | Mahōttarī | महोत्तरी जिल्ला | 361,054 | 440,146 | 553,481 | 627,580 | 706,994 | → |
| Parsa | District | Parsā | पर्सा जिल्ला | 284,338 | 372,524 | 497,219 | 601,017 | 654,471 | → |
| Rautahat | District | Rautahaṭa | रौतहट जिल्ला | 332,526 | 414,005 | 545,132 | 686,722 | 813,573 | → |
| Saptari | District | Saptarī | सप्तरी जिल्ला | 379,055 | 465,668 | 570,282 | 639,284 | 706,255 | → |
| Sarlahi | District | Sarlāhī | सर्लाही जिल्ला | 398,766 | 492,798 | 635,701 | 769,729 | 862,470 | → |
| Siraha | District | Sirāhā | सिराहा जिल्ला | 375,358 | 460,746 | 572,399 | 637,328 | 739,953 | → |
| Nepal | Federal Republic | Nēpāla | नेपाल | 15,022,839 | 18,491,097 | 23,151,423 | 26,494,504 | 29,164,578 |
Source: Central Bureau of Statistics Nepal (web).
Further information about the population structure:
| Gender (C 2021) | |
|---|---|
| Males | 3,065,751 |
| Females | 3,048,849 |
| Age Groups (C 2021) | |
|---|---|
| 0-14 years | 2,028,242 |
| 15-64 years | 3,700,734 |
| 65+ years | 385,624 |
| Age Distribution (C 2021) | |
|---|---|
| 90+ years | 7,898 |
| 80-89 years | 31,047 |
| 70-79 years | 191,039 |
| 60-69 years | 329,123 |
| 50-59 years | 442,907 |
| 40-49 years | 598,613 |
| 30-39 years | 807,896 |
| 20-29 years | 1,049,119 |
| 10-19 years | 1,312,371 |
| 0-9 years | 1,344,587 |
| Citizenhip (C 2021) | |
|---|---|
| Nepal | 6,087,176 |
| India | 27,307 |
| Other Citizenship | 114 |
| Place of Birth (C 2021) | |
|---|---|
| Same local unit | 4,713,228 |
| Other local unit in same district | 688,887 |
| Other district | 475,317 |
| Other country | 236,597 |
| Literacy (A5+) (C 2021) | |
|---|---|
| Yes | 3,477,413 |
| Only reading | 14,231 |
| No | 1,981,166 |