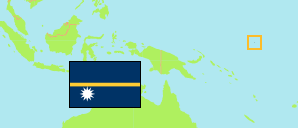
Districts
The population of the districts of Nauru by census years.
| Name | Abbr. | Area A (hect) | Population Census (C) 1992-04-17 | Population Census (C) 2002-09-23 | Population Census (C) 2011-10-30 | Population Census (C) 2019-10-30 | Population Census (C) 2021-10-30 | |||
|---|---|---|---|---|---|---|---|---|---|---|
| Nauru | NRU | 2,120 | 9,919 | 10,065 | 10,084 | 11,550 | 11,680 | |||
| Aiwo | 110 | 874 | 1,051 | 1,220 | 1,292 | 1,258 | 110 | |||
| Anabar | 150 | 320 | 378 | 452 | 418 | 565 | 150 | |||
| Anetan | 100 | 427 | 498 | 587 | 774 | 795 | 100 | |||
| Anibare | 310 | 165 | 232 | 226 | 317 | 373 | 310 | |||
| Baitsi (Baiti) | 120 | 450 | 443 | 513 | 656 | 523 | 120 | |||
| Boe | 50 | 750 | 731 | 851 | 987 | 845 | 50 | |||
| Buada | 260 | 661 | 673 | 739 | 962 | 969 | 260 | |||
| Denigomodu (Denig; incl. Location) | 90 | 2,626 | 2,673 | 1,804 | 1,861 | 1,874 | 90 | |||
| Ewa | 120 | 355 | 397 | 446 | 513 | 537 | 120 | |||
| Ijuw | 110 | 206 | 169 | 178 | 212 | 276 | 110 | |||
| Meneng | 310 | 1,389 | 1,323 | 1,380 | 1,729 | 1,797 | 310 | |||
| Nibok | 160 | 577 | 479 | 484 | 571 | 724 | 160 | |||
| Uaboe | 80 | 447 | 386 | 318 | 448 | 341 | 80 | |||
| Yaren | 150 | 672 | 632 | 747 | 810 | 803 | 150 |
- In contrast to the 2011 figures, which represent the resident population, the de facto population is tabulated for 1992 and 2002. The total resident population (without institutional population) was 9,600 in 1992 and 9,872 in 2002.
- Furthermore, the total population of 2011 includes 139 persons in institutions. The 2019 mini census covers only persons living in private households.
- PRISM / Nauru Bureau of Statistics (web).
Contents: Places
The main places of Nauru.
| Name | Population Census (C) 1992-04-17 | Population Census (C) 2002-09-23 | Population Census (C) 2011-10-30 | Population Census (C) 2019-10-30 | Population Census (C) 2021-10-30 | Area | |
|---|---|---|---|---|---|---|---|
| NPC Settlement (Location) | 2,301 | 2,381 | 1,497 | 1,464 | 1,526 | 0 | |
| Yaren | ... | ... | ... | ... | ... | 0 |
