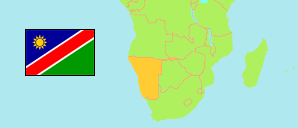
Kavango West
Region in Namibia
Contents: Subdivision
The population development in Kavango West as well as related information and services (Wikipedia, Google, images).
| Name | Status | Population Census 2011-08-28 | Population Census 2023-09-24 | |
|---|---|---|---|---|
| Kavango West | Region | 86,529 | 123,266 | |
| Kapako | Constituency | 20,359 | 27,823 | → |
| Mankumpi | Constituency | 4,464 | 6,910 | → |
| Mpungu | Constituency | 15,018 | 21,098 | → |
| Musese | Constituency | 10,011 | 13,659 | → |
| Ncamagoro | Constituency | 7,043 | 8,449 | → |
| Ncuncuni | Constituency | 8,541 | 10,943 | → |
| Nkurenkuru | Constituency | 7,064 | 15,887 | → |
| Tondoro | Constituency | 14,029 | 18,497 | → |
| Namibia | Republic | 2,113,077 | 3,022,401 |
Source: Namibia Statistics Agency.
Explanation: Boundaries according to the 4th delimitation.
Further information about the population structure:
| Gender (C 2023) | |
|---|---|
| Males | 59,420 |
| Females | 63,846 |
| Age Groups (C 2011) | |
|---|---|
| 0-14 years | 39,675 |
| 15-64 years | 42,474 |
| 65+ years | 4,380 |
| Age Distribution (C 2011) | |
|---|---|
| 0-9 years | 27,111 |
| 10-19 years | 23,363 |
| 20-29 years | 12,399 |
| 30-39 years | 7,868 |
| 40-49 years | 5,691 |
| 50-59 years | 3,720 |
| 60-69 years | 3,346 |
| 70-79 years | 1,684 |
| 80+ years | 1,347 |