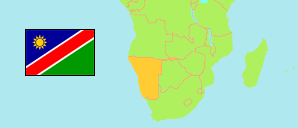
Otjozondjupa
Region in Namibia
Contents: Subdivision
The population development in Otjozondjupa as well as related information and services (Wikipedia, Google, images).
| Name | Status | Population Census 2011-08-28 | Population Census 2023-09-24 | |
|---|---|---|---|---|
| Otjozondjupa | Region | 143,903 | 220,811 | |
| Grootfontein | Constituency | 24,878 | 36,951 | → |
| Okahandja | Constituency | 24,451 | 46,061 | → |
| Okakarara | Constituency | 22,747 | 30,987 | → |
| Omatako | Constituency | 17,288 | 18,283 | → |
| Otavi | Constituency | 12,488 | 18,279 | → |
| Otjiwarongo | Constituency | 32,144 | 54,893 | → |
| Tsumkwe | Constituency | 9,907 | 15,357 | → |
| Namibia | Republic | 2,113,077 | 3,022,401 |
Source: Namibia Statistics Agency.
Explanation: Boundaries according to the 4th delimitation.
Further information about the population structure:
| Gender (C 2023) | |
|---|---|
| Males | 113,280 |
| Females | 107,531 |
| Age Groups (C 2011) | |
|---|---|
| 0-14 years | 52,109 |
| 15-64 years | 86,215 |
| 65+ years | 5,579 |
| Age Distribution (C 2011) | |
|---|---|
| 0-9 years | 36,883 |
| 10-19 years | 28,830 |
| 20-29 years | 26,916 |
| 30-39 years | 20,113 |
| 40-49 years | 13,850 |
| 50-59 years | 9,011 |
| 60-69 years | 4,426 |
| 70-79 years | 2,340 |
| 80+ years | 1,534 |