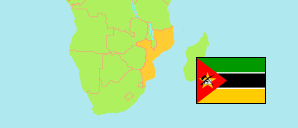
Maputo Cidade
City in Mozambique
Contents: Subdivision
The population development in Maputo Cidade as well as related information and services (Wikipedia, Google, images).
| Name | Status | Population Census 1997-08-01 | Population Census 2007-09-16 | Population Census 2017-08-01 | |
|---|---|---|---|---|---|
| Maputo Cidade | City | 971,567 | 1,094,628 | 1,080,277 | |
| KaMavota (Distrito Urbano 4) | City District | 228,244 | 293,270 | 326,771 | → |
| KaMaxakeni (Distrito Urbano 3) | City District | 210,551 | 223,628 | 195,556 | → |
| KaMphumu (Distrito Urbano 1) | City District | 154,284 | 108,096 | 76,157 | → |
| KaMubukwana (Distrito Urbano 5) | City District | 211,008 | 290,775 | 319,968 | → |
| KaNyaka (Inhaca) | City District | ... | 5,216 | 5,958 | → |
| KaTembe (Catembe) | City District | 4,730 | 19,371 | 28,788 | → |
| Nlhamankulu (Distrito Urbano 2) | City District | 162,750 | 154,272 | 127,079 | → |
| Moçambique [Mozambique] | Republic | 15,278,334 | 20,252,223 | 26,899,105 |
Source: Instituto Nacional de Estatistica Moçambique (web).
Explanation: The tabulated population figures are not adjusted for underenumeration; the average omission rate is estimated as 3.7% in 2017. In some cases population changes are also the result of boundary changes. Area figures of districts and cities are derived from geospatial data.
Further information about the population structure:
| Gender (C 2017) | |
|---|---|
| Males | 521,356 |
| Females | 558,921 |
| Age Groups (C 2017) | |
|---|---|
| 0-14 years | 341,196 |
| 15-64 years | 700,131 |
| 65+ years | 38,950 |
| Age Distribution (C 2017) | |
|---|---|
| 80+ years | 8,682 |
| 70-79 years | 15,490 |
| 60-69 years | 38,636 |
| 50-59 years | 72,158 |
| 40-49 years | 94,113 |
| 30-39 years | 152,805 |
| 20-29 years | 234,359 |
| 10-19 years | 234,192 |
| 0-9 years | 229,842 |