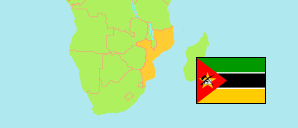
Inhambane
Province in Mozambique
Contents: Subdivision
The population development in Inhambane as well as related information and services (Wikipedia, Google, images).
| Name | Status | Population Census 1997-08-01 | Population Census 2007-09-16 | Population Census 2017-08-01 | |
|---|---|---|---|---|---|
| Inhambane | Province | 1,123,079 | 1,271,818 | 1,454,804 | |
| Funhalouro | District | 30,321 | 37,856 | 44,140 | → |
| Govuro | District | 29,031 | 34,494 | 36,094 | → |
| Homoine | District | 92,796 | 107,735 | 114,877 | → |
| Inhambane | City | 52,370 | 65,149 | 82,119 | → |
| Inharrime | District | 76,518 | 97,950 | 113,288 | → |
| Inhassoro | District | 43,406 | 48,190 | 57,037 | → |
| Jangamo | District | 81,210 | 93,402 | 105,306 | → |
| Mabote | District | 39,661 | 44,733 | 51,046 | → |
| Massinga | District | 186,650 | 186,292 | 236,939 | → |
| Maxixe | City | 93,985 | 108,824 | 129,993 | → |
| Morrumbene | District | 110,817 | 124,436 | 136,980 | → |
| Panda | District | 46,539 | 47,799 | 43,968 | → |
| Vilankulo (Vilanculos) | District | 113,045 | 135,813 | 151,709 | → |
| Zavala | District | 126,730 | 139,145 | 151,308 | → |
| Moçambique [Mozambique] | Republic | 15,278,334 | 20,252,223 | 26,899,105 |
Source: Instituto Nacional de Estatistica Moçambique (web).
Explanation: The tabulated population figures are not adjusted for underenumeration; the average omission rate is estimated as 3.7% in 2017. In some cases population changes are also the result of boundary changes. Area figures of districts and cities are derived from geospatial data.
Further information about the population structure:
| Gender (C 2017) | |
|---|---|
| Males | 665,240 |
| Females | 789,564 |
| Age Groups (C 2017) | |
|---|---|
| 0-14 years | 625,170 |
| 15-64 years | 743,766 |
| 65+ years | 85,868 |
| Age Distribution (C 2017) | |
|---|---|
| 80+ years | 22,740 |
| 70-79 years | 35,966 |
| 60-69 years | 57,783 |
| 50-59 years | 80,738 |
| 40-49 years | 113,892 |
| 30-39 years | 154,084 |
| 20-29 years | 198,020 |
| 10-19 years | 376,286 |
| 0-9 years | 415,295 |