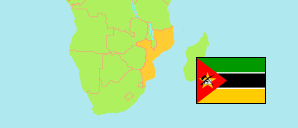
Sofala
Province in Mozambique
Contents: Subdivision
The population development in Sofala as well as related information and services (Wikipedia, Google, images).
| Name | Status | Population Census 1997-08-01 | Population Census 2007-09-16 | Population Census 2017-08-01 | |
|---|---|---|---|---|---|
| Sofala | Province | 1,289,390 | 1,642,920 | 2,196,845 | |
| Beira | City | 397,368 | 431,583 | 592,090 | → |
| Búzi | District | 143,152 | 159,459 | 177,415 | → |
| Caia | District | 86,001 | 115,612 | 158,256 | → |
| Chemba | District | 49,634 | 63,981 | 83,257 | → |
| Cheringoma | District | 20,795 | 34,093 | 57,572 | → |
| Chibabava | District | 72,273 | 102,006 | 135,202 | → |
| Dondo | District | 117,719 | 141,003 | 193,382 | → |
| Gorongosa | District | 77,877 | 117,129 | 176,845 | → |
| Machanga | District | 44,784 | 51,912 | 55,848 | → |
| Maringué | District | 56,654 | 75,135 | 95,362 | → |
| Marromeu | District | 69,895 | 117,795 | 154,361 | → |
| Muanza | District | 15,308 | 25,225 | 38,174 | → |
| Nhamatanda | District | 137,930 | 207,987 | 279,081 | → |
| Moçambique [Mozambique] | Republic | 15,278,334 | 20,252,223 | 26,899,105 |
Source: Instituto Nacional de Estatistica Moçambique (web).
Explanation: The tabulated population figures are not adjusted for underenumeration; the average omission rate is estimated as 3.7% in 2017. In some cases population changes are also the result of boundary changes. Area figures of districts and cities are derived from geospatial data.
Further information about the population structure:
| Gender (C 2017) | |
|---|---|
| Males | 1,062,113 |
| Females | 1,134,732 |
| Age Groups (C 2017) | |
|---|---|
| 0-14 years | 1,009,389 |
| 15-64 years | 1,120,895 |
| 65+ years | 66,561 |
| Age Distribution (C 2017) | |
|---|---|
| 80+ years | 15,187 |
| 70-79 years | 26,503 |
| 60-69 years | 57,732 |
| 50-59 years | 89,240 |
| 40-49 years | 143,027 |
| 30-39 years | 216,793 |
| 20-29 years | 376,757 |
| 10-19 years | 557,017 |
| 0-9 years | 714,589 |