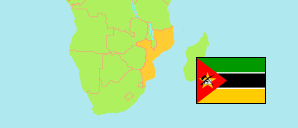
Tete
Province in Mozambique
Contents: Subdivision
The population development in Tete as well as related information and services (Wikipedia, Google, images).
| Name | Status | Population Census 1997-08-01 | Population Census 2007-09-16 | Population Census 2017-08-01 | |
|---|---|---|---|---|---|
| Tete | Province | 1,144,604 | 1,783,967 | 2,551,826 | |
| Angónia | District | 247,999 | 298,815 | 472,164 | → |
| Cahora-Bassa | District | 57,675 | 86,641 | 128,768 | → |
| Changara | District | 68,156 | 92,526 | 123,056 | → |
| Chifunde | District | 48,498 | 100,243 | 157,647 | → |
| Chiuta | District | 50,372 | 75,410 | 101,341 | → |
| Dôa (← Mutarara) | District | 24,306 | 67,618 | 87,077 | → |
| Macanga | District | 46,515 | 110,873 | 158,881 | → |
| Magoé | District | 39,304 | 68,852 | 89,273 | → |
| Marara (← Changara) | District | 51,395 | 64,019 | 73,044 | → |
| Marávia | District | 53,031 | 82,874 | 126,630 | → |
| Moatize | District | 109,103 | 215,092 | 260,843 | → |
| Mutarara | District | 106,437 | 139,392 | 168,058 | → |
| Tete | City | 101,984 | 155,870 | 307,338 | → |
| Tsangano | District | 106,557 | 169,392 | 214,560 | → |
| Zumbo | District | 33,272 | 56,350 | 83,144 | → |
| Moçambique [Mozambique] | Republic | 15,278,334 | 20,252,223 | 26,899,105 |
Source: Instituto Nacional de Estatistica Moçambique (web).
Explanation: The tabulated population figures are not adjusted for underenumeration; the average omission rate is estimated as 3.7% in 2017. In some cases population changes are also the result of boundary changes. Area figures of districts and cities are derived from geospatial data.
Further information about the population structure:
| Gender (C 2017) | |
|---|---|
| Males | 1,245,815 |
| Females | 1,306,011 |
| Age Groups (C 2017) | |
|---|---|
| 0-14 years | 1,219,535 |
| 15-64 years | 1,252,625 |
| 65+ years | 79,666 |
| Age Distribution (C 2017) | |
|---|---|
| 80+ years | 19,103 |
| 70-79 years | 32,534 |
| 60-69 years | 60,626 |
| 50-59 years | 89,462 |
| 40-49 years | 157,107 |
| 30-39 years | 267,048 |
| 20-29 years | 430,937 |
| 10-19 years | 612,315 |
| 0-9 years | 882,694 |