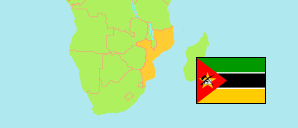
Nampula
Province in Mozambique
Contents: Subdivision
The population development in Nampula as well as related information and services (Wikipedia, Google, images).
| Name | Status | Population Census 1997-08-01 | Population Census 2007-09-16 | Population Census 2017-08-01 | |
|---|---|---|---|---|---|
| Nampula | Province | 2,975,747 | 3,985,613 | 5,483,382 | |
| Angoche | District | 228,526 | 276,471 | 347,176 | → |
| Eráti | District | 210,239 | 256,715 | 387,713 | → |
| Ilha de Mocambique [Island of Mozambique] | City | 42,407 | 48,063 | 64,577 | → |
| Lalaua | District | 55,912 | 73,536 | 107,369 | → |
| Larde (← Moma) | District | 48,857 | 68,872 | 98,385 | → |
| Liúpo (← Mogincual) | District | 35,248 | 63,792 | 89,259 | → |
| Malema | District | 128,732 | 164,898 | 213,011 | → |
| Meconta | District | 123,097 | 154,843 | 223,760 | → |
| Mecubúri | District | 118,726 | 155,624 | 207,285 | → |
| Memba | District | 188,992 | 229,824 | 328,460 | → |
| Mogincual | District | 57,072 | 66,177 | 98,177 | → |
| Mogovolas | District | 182,184 | 266,559 | 368,905 | → |
| Moma | District | 189,798 | 241,818 | 324,442 | → |
| Monapo | District | 226,968 | 304,060 | 393,813 | → |
| Mossuril | District | 89,457 | 116,301 | 174,641 | → |
| Muecate | District | 69,619 | 93,906 | 134,280 | → |
| Murrupula | District | 101,745 | 140,311 | 184,732 | → |
| Nacala (Nacala Porto) | City | 158,248 | 206,449 | 287,536 | → |
| Nacala-a-Velha | District | 77,918 | 88,807 | 121,726 | → |
| Nacarôa | District | 82,766 | 106,887 | 145,450 | → |
| Nampula | City | 303,346 | 471,717 | 760,214 | → |
| Rapale (Nampula Distrito) | District | 127,681 | 203,733 | 166,327 | → |
| Ribáuè | District | 128,209 | 186,250 | 256,144 | → |
| Moçambique [Mozambique] | Republic | 15,278,334 | 20,252,223 | 26,899,105 |
Source: Instituto Nacional de Estatistica Moçambique (web).
Explanation: The tabulated population figures are not adjusted for underenumeration; the average omission rate is estimated as 3.7% in 2017. In some cases population changes are also the result of boundary changes. Area figures of districts and cities are derived from geospatial data.
Further information about the population structure:
| Gender (C 2017) | |
|---|---|
| Males | 2,659,702 |
| Females | 2,823,680 |
| Age Groups (C 2017) | |
|---|---|
| 0-14 years | 2,692,635 |
| 15-64 years | 2,634,688 |
| 65+ years | 156,059 |
| Age Distribution (C 2017) | |
|---|---|
| 80+ years | 37,160 |
| 70-79 years | 62,252 |
| 60-69 years | 130,644 |
| 50-59 years | 219,156 |
| 40-49 years | 406,974 |
| 30-39 years | 558,894 |
| 20-29 years | 833,709 |
| 10-19 years | 1,195,578 |
| 0-9 years | 2,039,015 |