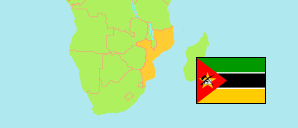
Niassa
Province in Mozambique
Contents: Subdivision
The population development in Niassa as well as related information and services (Wikipedia, Google, images).
| Name | Status | Population Census 1997-08-01 | Population Census 2007-09-16 | Population Census 2017-08-01 | |
|---|---|---|---|---|---|
| Niassa | Province | 756,287 | 1,170,783 | 1,713,751 | |
| Chimbonila (Lichinga Distrito) | District | 62,802 | 94,972 | 72,503 | → |
| Cuamba | District | 126,380 | 184,773 | 267,928 | → |
| Lago | District | 55,892 | 83,099 | 106,968 | → |
| Lichinga | City | 85,758 | 142,331 | 242,204 | → |
| Majune | District | 20,571 | 29,702 | 40,004 | → |
| Mandimba | District | 84,011 | 133,648 | 211,979 | → |
| Marrupa | District | 40,199 | 53,649 | 77,808 | → |
| Maúa | District | 38,390 | 49,397 | 68,260 | → |
| Mavago | District | 12,381 | 20,241 | 29,933 | → |
| Mecanhelas | District | 76,311 | 156,885 | 269,619 | → |
| Mecula | District | 10,972 | 13,779 | 20,888 | → |
| Metarica | District | 20,430 | 29,439 | 45,303 | → |
| Muembe | District | 18,680 | 28,645 | 43,787 | → |
| N'gauma | District | 33,721 | 64,049 | 95,823 | → |
| Nipepe | District | 25,564 | 30,009 | 45,086 | → |
| Sanga | District | 44,225 | 56,165 | 75,658 | → |
| Moçambique [Mozambique] | Republic | 15,278,334 | 20,252,223 | 26,899,105 |
Source: Instituto Nacional de Estatistica Moçambique (web).
Explanation: The tabulated population figures are not adjusted for underenumeration; the average omission rate is estimated as 3.7% in 2017. In some cases population changes are also the result of boundary changes. Area figures of districts and cities are derived from geospatial data.
Further information about the population structure:
| Gender (C 2017) | |
|---|---|
| Males | 833,704 |
| Females | 880,047 |
| Age Groups (C 2017) | |
|---|---|
| 0-14 years | 870,089 |
| 15-64 years | 796,816 |
| 65+ years | 46,846 |
| Age Distribution (C 2017) | |
|---|---|
| 80+ years | 11,672 |
| 70-79 years | 19,590 |
| 60-69 years | 34,617 |
| 50-59 years | 59,370 |
| 40-49 years | 106,474 |
| 30-39 years | 170,366 |
| 20-29 years | 265,533 |
| 10-19 years | 393,487 |
| 0-9 years | 652,642 |