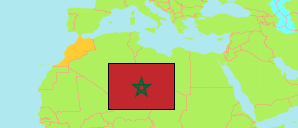
Tabia
Rural Commune in Béni Mellal-Khénifra Region
Contents: Population
The population development of Tabia as well as related information and services (Wikipedia, Google, images).
| Name | Status | Native | Population Census 1994-09-02 | Population Census 2004-09-02 | Population Census 2014-09-01 | Population Census 2024-09-01 | |
|---|---|---|---|---|---|---|---|
| Tabia | Rural Commune | تابية | 8,927 | 7,935 | 7,849 | 7,354 | |
| Béni Mellal - Khénifra | Region | بني ملال - خنيفرة | 2,137,675 | 2,307,566 | 2,520,776 | 2,525,801 |
Source: Haut Commissariat au Plan, Royaume du Maroc.
Explanation: Area figures are calculated using geospatial data. Some population changes are due to boundary changes.
Further information about the population structure:
| Gender (C 2014) | |
|---|---|
| Males | 4,037 |
| Females | 3,812 |
| Age Groups (C 2014) | |
|---|---|
| 0-14 years | 2,462 |
| 15-64 years | 4,702 |
| 65+ years | 685 |
| Age Distribution (C 2014) | |
|---|---|
| 70+ years | 469 |
| 60-69 years | 518 |
| 50-59 years | 704 |
| 40-49 years | 748 |
| 30-39 years | 1,050 |
| 20-29 years | 1,237 |
| 10-19 years | 1,377 |
| 0-9 years | 1,746 |
| Urbanization (C 2024) | |
|---|---|
| Rural | 7,354 |
| Citizenship (C 2024) | |
|---|---|
| Morocco | 7,354 |