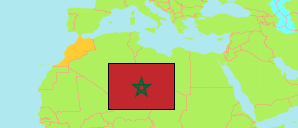
El Hajeb
Province in Morocco
Contents: Population
The population development of El Hajeb as well as related information and services (Wikipedia, Google, images).
| Name | Status | Native | Population Census 1994-09-02 | Population Census 2004-09-02 | Population Census 2014-09-01 | Population Projection 2023-07-01 | |
|---|---|---|---|---|---|---|---|
| El Hajeb | Province | الحاجب | 180,494 | 216,388 | 247,016 | 272,316 | |
| Al-Maghrib [Morocco] | Kingdom | المغرب | 25,821,571 | 29,475,763 | 33,337,529 | 36,403,782 |
Source: Haut Commissariat au Plan, Royaume du Maroc.
Explanation: Some population changes between 2004 and 2014 are due to boundary changes.
Further information about the population structure:
| Gender (C 2014) | |
|---|---|
| Males | 122,907 |
| Females | 123,266 |
| Age Groups (C 2014) | |
|---|---|
| 0-14 years | 69,318 |
| 15-64 years | 162,739 |
| 65+ years | 14,116 |
| Age Distribution (C 2014) | |
|---|---|
| 70+ years | 9,981 |
| 60-69 years | 11,758 |
| 50-59 years | 22,914 |
| 40-49 years | 30,780 |
| 30-39 years | 37,735 |
| 20-29 years | 42,194 |
| 10-19 years | 43,941 |
| 0-9 years | 46,870 |
| Urbanization (C 2014) | |
|---|---|
| Rural | 125,142 |
| Urban | 121,031 |
| Citizenship (C 2014) | |
|---|---|
| Morocco | 246,942 |
| Foreign Citizenship | 74 |
| Literacy (A10+) (C 2014) | |
|---|---|
| yes | 171,150 |
| no | 75,023 |