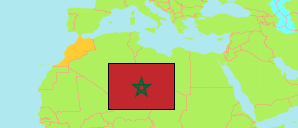
Rabat - Salé - Kénitra
Region in Morocco
Contents: Subdivision
The population development in Rabat - Salé - Kénitra as well as related information and services (Wikipedia, Google, images).
| Name | Status | Native | Population Census 1994-09-02 | Population Census 2004-09-02 | Population Census 2014-09-01 | Population Census 2024-09-01 | |
|---|---|---|---|---|---|---|---|
| Rabat - Salé - Kénitra | Region | الرباط - سلا - القنيطرة | 3,417,094 | 4,023,217 | 4,580,866 | 5,132,639 | |
| Kénitra | Province | القنيطرة | 695,142 | 853,631 | 1,061,435 | 1,284,247 | → |
| Khémisset | Province | الخميسات | 485,541 | 521,815 | 542,221 | 563,036 | → |
| Rabat | Prefecture | الرباط | 623,457 | 627,932 | 577,827 | 515,619 | → |
| Salé | Prefecture | سلا | 631,803 | 823,485 | 982,163 | 1,089,554 | → |
| Sidi Kacem | Province | سيدي قاسم | 452,282 | 489,422 | 522,270 | 545,509 | → |
| Sidi Slimane | Province | سيدي سليمان | 284,068 | 313,670 | 320,407 | 351,199 | → |
| Skhirate - Témara | Prefecture | الصخيرات - تمارة | 244,801 | 393,262 | 574,543 | 783,475 | → |
| Al-Maghrib [Morocco] | Kingdom | المغرب | 25,821,571 | 29,475,763 | 33,337,529 | 36,157,337 |
Source: Haut Commissariat au Plan, Royaume du Maroc.
Explanation: Area figures are calculated using geospatial data. Some population changes are due to boundary changes.
Further information about the population structure:
| Gender (C 2014) | |
|---|---|
| Males | 2,262,836 |
| Females | 2,289,749 |
| Age Groups (C 2014) | |
|---|---|
| 0-14 years | 1,244,416 |
| 15-64 years | 3,046,112 |
| 65+ years | 262,053 |
| Age Distribution (C 2014) | |
|---|---|
| 70+ years | 174,193 |
| 60-69 years | 245,026 |
| 50-59 years | 453,029 |
| 40-49 years | 560,372 |
| 30-39 years | 692,066 |
| 20-29 years | 795,325 |
| 10-19 years | 792,116 |
| 0-9 years | 840,454 |
| Urbanization (C 2024) | |
|---|---|
| Rural | 1,505,461 |
| Urban | 3,627,178 |
| Citizenship (C 2024) | |
|---|---|
| Morocco | 5,103,406 |
| Foreign Citizenship | 29,233 |
| Literacy (A10+) (C 2014) | |
|---|---|
| yes | 3,459,481 |
| no | 1,093,104 |
