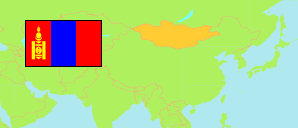
Övörchangaj
Province in Mongolia
Contents: Subdivision
The population development in Övörchangaj as well as related information and services (Wikipedia, Google, images).
| Name | Status | Native | Population Estimate 1990-12-31 | Population Estimate 2000-12-31 | Population Estimate 2010-12-31 | Population Estimate 2020-12-31 | Population Estimate 2021-12-31 | |
|---|---|---|---|---|---|---|---|---|
| Övörchangaj [Övörkhangai] | Province | Өвөрхангай | 97,805 | 111,466 | 100,504 | 116,785 | 117,261 | |
| Arvajchėėr [Arvaikheer] | District | Арвайхээр | 20,016 | 20,333 | 24,710 | 33,743 | 34,605 | → |
| Bajangol [Bayangol] | District | Баянгол | 3,452 | 4,693 | 3,965 | 3,825 | 3,753 | → |
| Bajan-Öndör [Bayan-Öndör] | District | Баян-Өндөр | 3,861 | 4,793 | 3,824 | 3,647 | 3,576 | → |
| Baruunbajan-Ulaan [Baruun Bayan-Ulaan] | District | Баруунбаян-Улаан | 2,251 | 2,890 | 2,363 | 2,784 | 2,732 | → |
| Bat-Ölzij [Bat-Ölzii] | District | Бат-Өлзий | 4,279 | 5,610 | 5,722 | 7,570 | 7,626 | → |
| Bogd | District | Богд | 4,186 | 5,840 | 4,809 | 5,803 | 5,794 | → |
| Bürd | District | Бүрд | 4,481 | 3,830 | 2,720 | 2,905 | 2,919 | → |
| Chajrchandulaan [Khairkhandulaan] | District | Хайрхандулаан | 3,425 | 4,033 | 3,108 | 3,504 | 3,493 | → |
| Charchorin [Kharkhorin] | District | Хархорин | 11,404 | 13,509 | 11,589 | 12,256 | 12,159 | → |
| Chujirt [Khujirt] | District | Хужирт | 8,418 | 7,639 | 6,108 | 6,803 | 6,782 | → |
| Gučin-Us [Guchin-Us] | District | Гучин-Ус | 2,133 | 2,382 | 2,012 | 2,197 | 2,157 | → |
| Narijntėėl [Nariinteel] | District | Нарийнтээл | 2,551 | 4,260 | 3,335 | 3,620 | 3,625 | → |
| Ölzijt [Ölziit] | District | Өлзийт | 3,177 | 3,393 | 2,452 | 2,389 | 2,346 | → |
| Sant | District | Сант | 3,324 | 4,254 | 3,082 | 3,534 | 3,514 | → |
| Taragt | District | Тарагт | 4,947 | 4,711 | 2,930 | 3,216 | 3,354 | → |
| Tögrög | District | Төгрөг | 2,500 | 2,897 | 2,479 | 2,731 | 2,699 | → |
| Ujanga [Uyanga] | District | Уянга | 5,950 | 7,394 | 8,661 | 9,542 | 9,504 | → |
| Züjl [Yesönzüil] | District | Зүйл | 3,234 | 3,675 | 2,905 | 2,857 | 2,781 | → |
| Züünbajan-Ulaan [Züünbayan-Ulaan] | District | Зүүнбаян-Улаан | 4,216 | 5,330 | 3,730 | 3,859 | 3,842 | → |
| Mongol uls [Mongolia] | State | Монгол улс | 2,050,044 | 2,374,617 | 2,653,828 | 3,253,283 | 3,312,275 |
Source: Mongolian National Statistical Office (web).
Explanation: Population figures refer to the resident population which excludes citizens living abroad for more than six months and includes foreign and stateless people living for more than six months in Mongolia. Area and density figures of districts computed by using geospatial data.
Further information about the population structure:
| Gender (E 2021) | |
|---|---|
| Males | 58,329 |
| Females | 58,932 |
| Age Groups (E 2021) | |
|---|---|
| 0-14 years | 37,364 |
| 15-64 years | 74,227 |
| 65+ years | 5,670 |
| Age Distribution (E 2021) | |
|---|---|
| 0-9 years | 26,065 |
| 10-19 years | 19,963 |
| 20-29 years | 18,143 |
| 30-39 years | 17,251 |
| 40-49 years | 15,003 |
| 50-59 years | 11,523 |
| 60-69 years | 5,952 |
| 70+ years | 3,361 |
| Urbanization (E 2021) | |
|---|---|
| Rural | 82,656 |
| Urban | 34,605 |