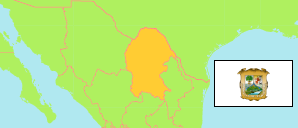
State
The population development of the State of Coahuila de Zaragoza according to census results.
| Name | Abbr. | Status | Capital | Area A-L (km²) | Population Census (C) 1990-03-12 | Population Census (C) 1995-11-05 | Population Census (C) 2000-02-14 | Population Census (C) 2005-10-17 | Population Census (Cf) 2010-05-31 | Population Census (C) 2020-03-15 | |||
|---|---|---|---|---|---|---|---|---|---|---|---|---|---|
| Mexico | MEX | Fed Rep | Ciudad de México | 1,959,248 | 81,249,645 | 91,120,433 | 97,483,412 | 103,263,388 | 112,336,538 | 126,014,024 | |||
| Coahuila de Zaragoza | COA | FSt | Saltillo | 151,563 | 1,972,340 | 2,173,775 | 2,298,070 | 2,495,200 | 2,748,391 | 3,146,771 | 15156300 | → |
- Instituto Nacional de Estadística Geografía e Informática, México (web).
Major Cities
| Name | Population Census (C) 2020-03-15 | |
|---|---|---|
| 1 | Saltillo | 864,431 |
| 2 | Torreón | 690,193 |
| 3 | Monclova | 237,169 |
| 4 | Piedras Negras | 173,959 |
| 5 | Ciudad Acuña | 160,225 |
| 6 | Ramos Arizpe | 114,010 |
| 7 | Frontera | 75,242 |
| 8 | Matamoros | 59,762 |
| 9 | Sabinas | 59,196 |
Contents: Cities & Towns
The population of all urban localities (localidades) in the State of Coahuila de Zaragoza with more than 20,000 inhabitants according to census results.
| Name | Population Census (C) 1990-03-12 | Population Census (C) 1995-11-05 | Population Census (C) 2000-02-14 | Population Census (C) 2005-10-17 | Population Census (Cf) 2010-05-31 | Population Census (C) 2020-03-15 | Area | ||
|---|---|---|---|---|---|---|---|---|---|
| Allende (Ciudad de Allende) | 16,649 | 17,753 | 18,679 | 18,283 | 20,694 | 21,376 | 1001 | → | |
| Castaños | 18,368 | 19,035 | 19,794 | 21,272 | 23,649 | 27,314 | 1894 | → | |
| Ciudad Acuña | 52,983 | 79,211 | 108,191 | 124,558 | 134,286 | 160,225 | 4124 | → | |
| Ciudad Melchor Múzquiz | 29,819 | ... | 32,094 | 31,999 | 35,060 | 38,992 | 1519 | → | |
| Francisco I. Madero | 26,227 | 26,201 | 26,354 | 30,084 | 26,632 | 32,704 | 1011 | → | |
| Frontera | 58,216 | 60,434 | 62,930 | 65,618 | 69,462 | 75,242 | 2266 | → | |
| Matamoros | 39,091 | 41,610 | 44,053 | 48,511 | 52,233 | 59,762 | 1732 | → | |
| Monclova | 177,792 | 188,850 | 192,554 | 198,873 | 215,475 | 237,169 | 7220 | → | |
| Nava | ... | 16,076 | 17,730 | 19,971 | 22,192 | 26,963 | 961 | → | |
| Nueva Rosita | 36,326 | 37,159 | 36,974 | 36,646 | 38,166 | 39,058 | 1579 | → | |
| Parras de la Fuente | 26,160 | 29,999 | 31,032 | 33,115 | 33,817 | 34,798 | 2555 | → | |
| Piedras Negras | 96,178 | 114,384 | 126,404 | 142,030 | 150,966 | 173,959 | 5386 | → | |
| Ramos Arizpe | 16,796 | 26,229 | 31,339 | 49,009 | 67,260 | 114,010 | 4152 | → | |
| Sabinas | 42,567 | 45,854 | 47,578 | 47,933 | 54,905 | 59,196 | 2891 | → | |
| Saltillo | 420,947 | 510,131 | 562,587 | 633,669 | 709,674 | 864,431 | 19487 | → | |
| San Buenaventura | 17,511 | 17,743 | 17,904 | 17,951 | 20,487 | 23,413 | 1048 | → | |
| San Pedro de las Colonias | 40,371 | 42,088 | 41,642 | 43,454 | 48,746 | 49,490 | 1394 | → | |
| Torreón | 439,436 | 481,493 | 504,205 | 550,406 | 611,447 | 690,193 | 15280 | → |
- The tabulated population figures (apart from 1990 and 1995) consider amalgamations of localities since 2000.
- Instituto Nacional de Estadística Geografía e Informática, México (web).