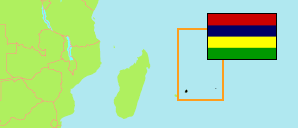
Mare La Chaux
Village Council Area in Mauritius Island
Contents: Population
The population development in Mare La Chaux as well as related information and services (Wikipedia, Google, images).
| Name | Status | Population Census 2000-07-02 | Population Census 2011-07-03 | Population Census 2022-07-03 | |
|---|---|---|---|---|---|
| Mare La Chaux | Village Council Area | 1,885 | 1,925 | 1,839 | |
| Mauritius | Island | 1,143,069 | 1,196,383 | 1,189,493 |
Source: Central Statistical Office of Mauritius.
Explanation: Area figures are computed by using geospatial data.
Further information about the population structure:
| Gender (C 2022) | |
|---|---|
| Males | 893 |
| Females | 946 |
| Age Groups (C 2022) | |
|---|---|
| 0-14 years | 247 |
| 15-64 years | 1,364 |
| 65+ years | 228 |
| Age Distribution (C 2022) | |
|---|---|
| 70+ years | 127 |
| 60-69 years | 218 |
| 50-59 years | 267 |
| 40-49 years | 313 |
| 30-39 years | 230 |
| 20-29 years | 275 |
| 10-19 years | 278 |
| 0-9 years | 131 |
| Urbanization (C 2022) | |
|---|---|
| Rural | 1,839 |
| Language at Home (C 2022) | |
|---|---|
| Creole | 756 |
| French | 6 |
| English | 6 |
| Bhojpuri | 1,057 |
| Hindi | 10 |
| Other language | 4 |
| Religion (C 2022) | |
|---|---|
| Hindus | 1,543 |
| Buddhists | 1 |
| Roman Catholics | 190 |
| Other Christians | 101 |
| Other/no religion | 4 |