Malaysia
National
-

News
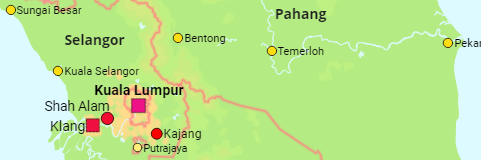
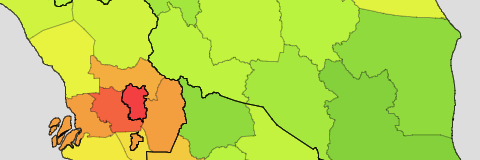
According to first results of the 2020 census, the total population of Malaysia is counted as 32.447 million. This means an increase of 4.963 million since the last census 10 years ago (+ 18%). The population of Putrajaya federal territory grew by almost 60% from 68,361 to 109,202.
2022-03-01
-
States, Territories & Urban Areas
The states and federal territories as well as urban areas and major conurbations.
(1980), 1991, 2000, 2010, (2020) census, (2023 estimate)
-
Administrative Division
The population of the states, federal territories and districts of Malaysia.
2000, 2010, 2020 census, 2023 estimate
-

States: Districts & Townships (Mukims)
2010, 2020 census – Labuan and Putrajaya are not subdivided.