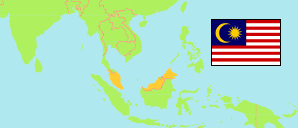
Sabah
State in Malaysia
Contents: Subdivision
The population development in Sabah as well as related information and services (Wikipedia, Google, images).
| Name | Status | Population Census 2000-07-05 | Population Census 2010-07-06 | Population Census 2020-07-07 | Population Estimate 2023-07-01 | |
|---|---|---|---|---|---|---|
| Sabah | State | 2,603,485 | 3,206,742 | 3,418,785 | 3,592,800 | |
| Beaufort | District | 64,756 | 66,406 | 75,716 | 77,100 | → |
| Beluran (Labuk-Sugut) | District | 58,393 | 77,318 | 77,125 | 83,800 | → |
| Kalabakan (← Tawau) | District | 36,959 | 47,229 | 48,195 | 53,200 | → |
| Keningau | District | 155,069 | 177,735 | 150,927 | 156,000 | → |
| Kinabatangan | District | 96,986 | 150,327 | 143,112 | 149,000 | → |
| Kota Belud | District | 75,568 | 93,180 | 107,243 | 109,500 | → |
| Kota Kinabalu | District | 372,047 | 462,963 | 500,421 | 525,300 | → |
| Kota Marudu | District | 61,642 | 68,289 | 69,528 | 72,300 | → |
| Kuala Penyu | District | 17,228 | 19,426 | 23,710 | 24,200 | → |
| Kudat | District | 73,349 | 85,404 | 86,410 | 90,600 | → |
| Kunak | District | 52,271 | 62,851 | 68,893 | 76,100 | → |
| Lahad Datu | District | 166,011 | 206,861 | 229,138 | 241,200 | → |
| Nabawan / Persiangan | District | 25,285 | 32,309 | 28,349 | 30,100 | → |
| Papar | District | 92,451 | 128,434 | 150,667 | 154,600 | → |
| Penampang | District | 86,621 | 125,913 | 162,174 | 165,700 | → |
| Pitas | District | 33,910 | 38,764 | 36,660 | 37,900 | → |
| Putatan (← Penampang) | District | 50,381 | 55,864 | 68,811 | 70,200 | → |
| Ranau | District | 74,456 | 95,800 | 85,077 | 87,500 | → |
| Sandakan | District | 368,916 | 409,056 | 439,050 | 469,700 | → |
| Semporna | District | 114,989 | 137,868 | 166,587 | 186,000 | → |
| Sipitang | District | 30,653 | 35,764 | 37,828 | 39,300 | → |
| Tambunan | District | 29,294 | 36,297 | 31,573 | 32,700 | → |
| Tawau | District | 285,746 | 365,146 | 372,615 | 393,800 | → |
| Telupid (← Beluran) | District | 22,139 | 29,314 | 29,241 | 30,300 | → |
| Tenom | District | 48,353 | 56,597 | 51,328 | 52,900 | → |
| Tongod | District | 25,038 | 36,192 | 42,742 | 43,900 | → |
| Tuaran | District | 84,974 | 105,435 | 135,665 | 139,900 | → |
| Malaysia | Federation | 23,274,690 | 28,334,135 | 32,447,385 | 33,379,500 |
Source: Department of Statistics Malaysia.
Further information about the population structure:
| Gender (E 2023) | |
|---|---|
| Males | 1,874,800 |
| Females | 1,718,000 |
| Age Groups (E 2023) | |
|---|---|
| 0-14 years | 874,500 |
| 15-64 years | 2,501,500 |
| 65+ years | 217,000 |
| Age Distribution (E 2023) | |
|---|---|
| 80+ years | 32,300 |
| 70-79 years | 90,500 |
| 60-69 years | 185,500 |
| 50-59 years | 251,800 |
| 40-49 years | 402,300 |
| 30-39 years | 619,400 |
| 20-29 years | 761,600 |
| 10-19 years | 668,800 |
| 0-9 years | 580,800 |
| Urbanization (C 2020) | |
|---|---|
| Rural | 1,549,736 |
| Urban | 1,869,049 |
| Religion (C 2020) | |
|---|---|
| Muslims | 2,379,216 |
| Christians | 843,734 |
| Buddhists | 173,241 |
| Hindus | 4,948 |
| Other religion | 3,772 |
| No religion | 10,300 |