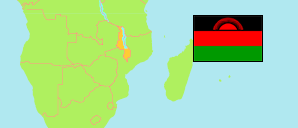
Ntcheu
District in Malawi
Contents: Subdivision
The population in Ntcheu as well as related information and services (Wikipedia, Google, images).
| Name | Status | Population Census 2018-09-03 | |
|---|---|---|---|
| Ntcheu | District | 659,608 | |
| Chakhumbira | Traditional Authority | 35,074 | → |
| Champiti | Traditional Authority | 21,607 | → |
| Goodson Ganya | Traditional Authority | 143,536 | → |
| Kwataine | Traditional Authority | 53,379 | → |
| Makwangwala | Traditional Authority | 87,215 | → |
| Masasa | Traditional Authority | 35,326 | → |
| Mkutumula | Senior Traditional Authority | 29,361 | → |
| Mpando | Traditional Authority | 77,612 | → |
| Njolomole | Traditional Authority | 71,003 | → |
| Ntcheu | Settlement | 21,241 | → |
| Phambala | Traditional Authority | 44,626 | → |
| Tsikulamowa | Senior Traditional Authority | 39,628 | → |
| Malawi | Republic | 17,563,749 |
Source: National Statistical Office of Malawi.
Further information about the population structure:
| Age Groups (C 2018) | |
|---|---|
| 0-14 years | 287,606 |
| 15-64 years | 342,997 |
| 65+ years | 29,005 |
| Age Distribution (C 2018) | |
|---|---|
| 0-9 years | 192,745 |
| 10-19 years | 171,160 |
| 20-29 years | 106,670 |
| 30-39 years | 76,034 |
| 40-49 years | 46,178 |
| 50-59 years | 27,730 |
| 60-69 years | 21,328 |
| 70+ years | 17,763 |