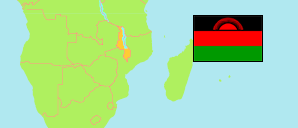
Ntcheu
District in Malawi
Contents: Population
The population development of Ntcheu as well as related information and services (Wikipedia, Google, images).
| Name | Status | Population Census 1977-09-20 | Population Census 1987-09-01 | Population Census 1998-09-01 | Population Census 2008-06-08 | Population Census 2018-09-03 | Population Projection 2023-09-03 | |
|---|---|---|---|---|---|---|---|---|
| Ntcheu | District | 226,454 | 358,767 | 370,757 | 471,353 | 659,608 | 755,748 | |
| Malawi | Republic | 5,547,460 | 7,988,507 | 9,933,868 | 13,029,498 | 17,563,749 | 19,809,511 |
Source: National Statistical Office of Malawi.
Explanation: Population figures until 1998 are de facto, later figures are de jure.
Further information about the population structure:
| Gender (P 2023) | |
|---|---|
| Males | 368,872 |
| Females | 386,876 |
| Age Groups (P 2023) | |
|---|---|
| 0-14 years | 304,890 |
| 15-64 years | 418,506 |
| 65+ years | 32,352 |
| Age Distribution (P 2023) | |
|---|---|
| 0-9 years | 208,227 |
| 10-19 years | 183,059 |
| 20-29 years | 130,208 |
| 30-39 years | 90,024 |
| 40-49 years | 58,739 |
| 50-59 years | 39,160 |
| 60-69 years | 25,881 |
| 70-79 years | 13,309 |
| 80+ years | 7,141 |
| Urbanization (C 2018) | |
|---|---|
| Rural | 638,367 |
| Urban | 21,241 |
| Citizenship (C 2018) | |
|---|---|
| Malawi | 658,468 |
| Foreign Citizenship | 1,140 |
| Country of Birth (C 2018) | |
|---|---|
| Malawi | 655,776 |
| Other Country | 3,832 |
| Religion (C 2018) | |
|---|---|
| Christians | 571,735 |
| Muslims | 15,987 |
| Traditional Religion | 4,883 |
| Other religion | 45,639 |
| No religion | 21,364 |
| Literacy (A5+) (C 2018) | |
|---|---|
| yes | 377,590 |
| no | 186,810 |
| Tribe (C 2018) | |
|---|---|
| Chewa | 15,230 |
| Tumbuka | 1,661 |
| Lomwe | 21,664 |
| Yao | 15,196 |
| Ngoni | 595,432 |
| Sena | 3,642 |
| Mang'anja | 2,109 |
| Other Tribe | 3,534 |