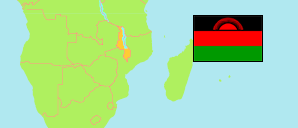
Dowa
District in Malawi
Contents: Population
The population development of Dowa as well as related information and services (Wikipedia, Google, images).
| Name | Status | Population Census 1977-09-20 | Population Census 1987-09-01 | Population Census 1998-09-01 | Population Census 2008-06-08 | Population Census 2018-09-03 | Population Projection 2023-09-03 | |
|---|---|---|---|---|---|---|---|---|
| Dowa | District | 247,603 | 322,432 | 411,387 | 559,849 | 772,569 | 879,386 | |
| Malawi | Republic | 5,547,460 | 7,988,507 | 9,933,868 | 13,029,498 | 17,563,749 | 19,809,511 |
Source: National Statistical Office of Malawi.
Explanation: Population figures until 1998 are de facto, later figures are de jure.
Further information about the population structure:
| Gender (P 2023) | |
|---|---|
| Males | 430,683 |
| Females | 448,703 |
| Age Groups (P 2023) | |
|---|---|
| 0-14 years | 346,440 |
| 15-64 years | 499,336 |
| 65+ years | 33,609 |
| Age Distribution (P 2023) | |
|---|---|
| 0-9 years | 232,787 |
| 10-19 years | 213,626 |
| 20-29 years | 155,866 |
| 30-39 years | 106,067 |
| 40-49 years | 74,510 |
| 50-59 years | 47,627 |
| 60-69 years | 26,702 |
| 70-79 years | 14,687 |
| 80+ years | 7,513 |
| Urbanization (C 2018) | |
|---|---|
| Rural | 740,891 |
| Urban | 31,678 |
| Citizenship (C 2018) | |
|---|---|
| Malawi | 751,947 |
| Foreign Citizenship | 20,622 |
| Country of Birth (C 2018) | |
|---|---|
| Malawi | 753,649 |
| Other Country | 18,920 |
| Religion (C 2018) | |
|---|---|
| Christians | 665,191 |
| Muslims | 7,038 |
| Traditional Religion | 7,292 |
| Other religion | 59,396 |
| No religion | 33,652 |
| Literacy (A5+) (C 2018) | |
|---|---|
| yes | 442,118 |
| no | 224,980 |
| Tribe (C 2018) | |
|---|---|
| Chewa | 690,553 |
| Tumbuka | 4,412 |
| Lomwe | 3,970 |
| Yao | 4,773 |
| Ngoni | 44,070 |
| Sena | 422 |
| Mang'anja | 493 |
| Other Tribe | 3,254 |
