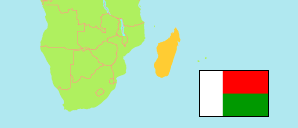
Vatovavy-Fitovinany
Region in Madagascar
Contents: Subdivision
The population development in Vatovavy-Fitovinany as well as related information and services (Wikipedia, Google, images).
| Name | Status | Population Census 1993-08-01 | Population Census 2018-06-01 | Population Projection 2020-06-01 | |
|---|---|---|---|---|---|
| Vatovavy-Fitovinany | Region | 750,468 | 1,440,657 | 1,534,754 | |
| Ifanadiana | District | 103,710 | 174,444 | 183,553 | → |
| Ikongo | District | 81,627 | 204,475 | 222,580 | → |
| Manakara (Manakara Atsimo) | District | 178,608 | 385,860 | 414,818 | → |
| Mananjary | District | 177,041 | 276,887 | 289,411 | → |
| Nosy Varika | District | 134,709 | 254,344 | 270,332 | → |
| Vohipeno | District | 74,773 | 144,647 | 154,060 | → |
| Madagascar | Republic | 12,238,914 | 25,674,196 | 27,190,927 |
Source: Institut National de la Statistique Madagascar (web).
Explanation: The 2018 figures are final. The enumeration took place from May 18 to June 25, 2018. The surface of districts is computed by using geospatial data.