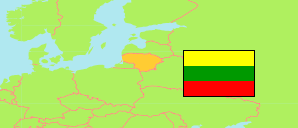
Panevėžys
County in Lithuania
Contents: Subdivision
The population development in Panevėžys as well as related information and services (Wikipedia, Google, images).
| Name | Status | Population Census 2001-04-06 | Population Census 2011-04-05 | Population Census 2021-01-01 | Population Estimate 2024-01-01 | |
|---|---|---|---|---|---|---|
| Panevėžys | County | 299,990 | 250,390 | 216,233 | 209,071 | |
| Biržai | District Municipality | 35,417 | 28,171 | 23,314 | 22,111 | → |
| Kupiškis | District Municipality | 24,628 | 20,251 | 16,530 | 15,765 | → |
| Panevėžys | City Municipality | 119,749 | 99,690 | 89,100 | 86,599 | → |
| Panevėžys | District Municipality | 42,855 | 39,011 | 35,426 | 35,378 | → |
| Pasvalys | District Municipality | 34,920 | 28,378 | 23,148 | 21,930 | → |
| Rokiškis | District Municipality | 42,421 | 34,889 | 28,715 | 27,288 | → |
| Lietuva [Lithuania] | Republic | 3,483,972 | 3,043,429 | 2,810,761 | 2,886,515 |
Source: Department of Statistics, Republic of Lithuania.
Explanation: The tabulated population estimates are preliminary.
Further information about the population structure:
| Gender (E 2024) | |
|---|---|
| Males | 96,163 |
| Females | 112,908 |
| Age Groups (E 2024) | |
|---|---|
| 0-17 years | 31,529 |
| 18-64 years | 127,870 |
| 65+ years | 49,672 |
| Age Distribution (E 2024) | |
|---|---|
| 80+ years | 15,164 |
| 70-79 years | 19,952 |
| 60-69 years | 33,393 |
| 50-59 years | 34,273 |
| 40-49 years | 24,438 |
| 30-39 years | 24,956 |
| 20-29 years | 21,292 |
| 10-19 years | 19,431 |
| 0-9 years | 16,172 |
| Urbanization (E 2024) | |
|---|---|
| Rural | 83,213 |
| Urban | 125,858 |
| Citizenship (C 2021) | |
|---|---|
| Lithuania | 215,510 |
| Several Citizenships | 239 |
| Other Citizenship | 484 |
| Country of Birth (C 2021) | |
|---|---|
| Lithuania | 209,309 |
| Other Country | 6,924 |
| Ethnic Group (C 2021) | |
|---|---|
| Lithuanians | 208,060 |
| Poles | 515 |
| Russians | 4,002 |
| Ukrainians | 476 |
| Belarusians | 266 |
| Other Ethnic Group | 658 |
| Religion (C 2021) | |
|---|---|
| Catholic | 175,421 |
| Orthodox | 1,995 |
| Other Religion | 5,326 |
| No Religion | 13,642 |
