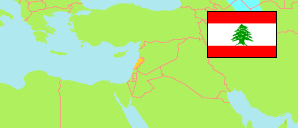
Al-Biqā'
Governorate in Lebanon
Contents: Subdivision
The population development in Al-Biqā' as well as related information and services (Wikipedia, Google, images).
| Name | Status | Native | Population Estimate 1996-12-31 | Population Estimate 2007-12-31 | Population Estimate 2011-12-31 | Population Estimate 2017-12-31 | |
|---|---|---|---|---|---|---|---|
| Al-Biqā' [Beqaa] | Governorate | البقاع | 203,867 | 244,231 | 268,468 | 534,342 | |
| Al-Biqā' al-Gharbī [Békaa Ouest, Western Beqaa] | District | قضاء البقاع الغربي | 55,692 | 68,477 | 76,917 | 150,838 | → |
| Rāshayyā [Rachaiya] | District | قضاء راشيّا | 23,839 | 30,031 | 33,657 | 47,122 | → |
| Zaḥlah [Zahlé] | District | قضاء زحلة | 124,336 | 145,723 | 157,894 | 336,382 | → |
| Lubnān [Lebanon] | Republic | لبنان | 3,111,832 | 3,759,134 | 4,036,450 | 5,416,225 |
Source: Ministry of Public Health, Lebanese Republic (web), UNHCR (web), Lebanese Palestinean Dialogue Committee (web).
Explanation: The tabulated population figures include registered Syrian refugees (995,512 in January 2018). The number of non-registered Syrian refugees is estimed to be about 400,000. Palestine refugees residing in camps and gatherings (174,422 according to the mid-2017 census) are not included in the regular population figures but reported by the detail pages. Furthermore, there are about 40,000 Palestinian refugees from Syria in Lebanon. The actual total end-of-2017 population of Lebanon was – using these numbers – about 6.05 million.
Further information about the population structure:
| Population Groups (E 2017) | |
|---|---|
| Residential population | 302,186 |
| Registered Syrian refugees | 232,156 |
| Palestine refugees residing in camps and gatherings | 4,384 |