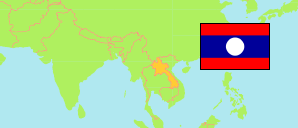
Huaphanh
Province in Laos
Contents: Subdivision
The population development in Huaphanh as well as related information and services (Wikipedia, Google, images).
| Name | Status | Native | Population Census 1995-03-01 | Population Census 2005-03-01 | Population Estimate 2015-07-01 | Population Projection 2020-07-01 | |
|---|---|---|---|---|---|---|---|
| Huaphanh [Houaphan] | Province | ຫົວພັນ | 246,414 | 280,938 | 298,372 | 310,976 | |
| Et | District | ແອດ | ... | 26,924 | 27,770 | 28,481 | → |
| Hiem [Viangthong] | District | ຮ້ຽມ | ... | ... | 12,470 | 13,207 | → |
| Houameuang | District | ຫົວເມືອງ | 23,462 | 28,120 | 33,779 | 35,215 | → |
| Kuan | District | ກວັນ | ... | ... | 25,645 | 27,404 | → |
| Sopbao | District | ສົບເບົາ | ... | 26,435 | 26,344 | 27,075 | → |
| Viengxay | District | ວຽງໄຊ | ... | ... | 32,697 | 33,251 | → |
| Xamneua | District | ຊຳເໜືອ | 46,728 | 54,372 | 58,739 | 61,654 | → |
| Xamtay [Samtay] | District | ຊຳໃຕ້ | ... | ... | 37,894 | 39,698 | → |
| Xiengkhor | District | ຊຽງຄໍ້ | ... | 26,815 | 26,473 | 27,180 | → |
| Xon [Sone] | District | ຊ່ອນ | ... | ... | 16,562 | 17,814 | → |
| Laos | Democratic Republic | ປະເທດລາວ | 4,581,258 | 5,621,982 | 6,671,680 | 7,231,210 |
Source: Lao Statistics Bureau (web).
Explanation: The population figures for 2015 and later are based on the results of the 2015 census and are adjusted for underenumeration. Area figures of districts are derived from geospatial data.
Further information about the population structure:
| Gender (P 2020) | |
|---|---|
| Males | 157,614 |
| Females | 153,362 |
| Age Groups (P 2020) | |
|---|---|
| 0-14 years | 110,525 |
| 15-64 years | 187,171 |
| 65+ years | 13,278 |
| Age Distribution (P 2020) | |
|---|---|
| 0-9 years | 74,636 |
| 10-19 years | 72,003 |
| 20-29 years | 53,267 |
| 30-39 years | 38,968 |
| 40-49 years | 30,073 |
| 50-59 years | 20,947 |
| 60-69 years | 13,055 |
| 70-79 years | 5,824 |
| 80+ years | 2,201 |
| Urbanization (C 2015) | |
|---|---|
| Rural with Road Connection | 148,528 |
| Rural without Road Connection | 99,383 |
| Urban | 41,482 |