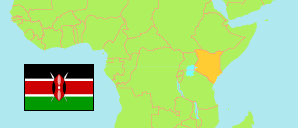
Matungulu
Subcounty in Kenya
Contents: Population
The population development of Matungulu as well as related information and services (Wikipedia, Google, images).
| Name | Status | Population Census 2009-08-24 | Population Census 2019-08-24 | |
|---|---|---|---|---|
| Matungulu | Subcounty | 124,736 | 161,557 | |
| Kenya | Republic | 38,610,097 | 47,564,296 |
Source: Kenya National Bureau of Statistics.
Further information about the population structure:
| Gender (C 2019) | |
|---|---|
| Males | 81,145 |
| Females | 80,407 |
| Intersex | 5 |
| Age Groups (C 2019) | |
|---|---|
| 0-14 years | 53,669 |
| 15-64 years | 98,436 |
| 65+ years | 9,446 |
| Age Distribution (C 2019) | |
|---|---|
| 90+ years | 705 |
| 80-89 years | 1,616 |
| 70-79 years | 3,643 |
| 60-69 years | 8,228 |
| 50-59 years | 11,154 |
| 40-49 years | 17,774 |
| 30-39 years | 23,139 |
| 20-29 years | 24,427 |
| 10-19 years | 37,123 |
| 0-9 years | 33,742 |