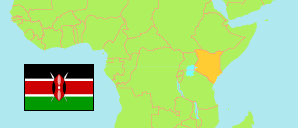
Migori
County in Kenya
Contents: Subdivision
The population development in Migori as well as related information and services (Wikipedia, Google, images).
| Name | Status | Population Census 2009-08-24 | Population Census 2019-08-24 | |
|---|---|---|---|---|
| Migori | County | 917,170 | 1,116,436 | |
| Awendo | Subcounty | 108,913 | 117,290 | → |
| Kuria East | Subcounty | 81,833 | 96,872 | → |
| Kuria West | Subcounty | 174,253 | 208,513 | → |
| Nyatike | Subcounty | 144,625 | 176,162 | → |
| Rongo | Subcounty | 100,547 | 124,587 | → |
| Suna East | Subcounty | 97,121 | 122,674 | → |
| Suna West | Subcounty | 94,127 | 128,890 | → |
| Uriri | Subcounty | 115,751 | 141,448 | → |
| Kenya | Republic | 38,610,097 | 47,564,296 |
Source: Kenya National Bureau of Statistics.
Further information about the population structure:
| Gender (C 2019) | |
|---|---|
| Males | 536,187 |
| Females | 580,214 |
| Intersex | 35 |
| Age Groups (C 2019) | |
|---|---|
| 0-14 years | 512,778 |
| 15-64 years | 567,493 |
| 65+ years | 36,113 |
| Age Distribution (C 2019) | |
|---|---|
| 90+ years | 1,381 |
| 80-89 years | 6,353 |
| 70-79 years | 15,422 |
| 60-69 years | 30,066 |
| 50-59 years | 42,621 |
| 40-49 years | 72,454 |
| 30-39 years | 119,956 |
| 20-29 years | 180,675 |
| 10-19 years | 314,308 |
| 0-9 years | 333,148 |
