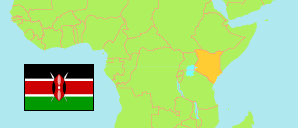
Kisumu
County in Kenya
Contents: Subdivision
The population development in Kisumu as well as related information and services (Wikipedia, Google, images).
| Name | Status | Population Census 2009-08-24 | Population Census 2019-08-24 | |
|---|---|---|---|---|
| Kisumu | County | 968,909 | 1,155,574 | |
| Kisumu Central | Subcounty | 168,892 | 174,145 | → |
| Kisumu East | Subcounty | 150,124 | 220,997 | → |
| Kisumu West | Subcounty | 131,246 | 172,821 | → |
| Muhoroni | Subcounty | 145,764 | 154,116 | → |
| Nyakach | Subcounty | 133,041 | 150,320 | → |
| Nyando | Subcounty | 141,037 | 161,508 | → |
| Seme | Subcounty | 98,805 | 121,667 | → |
| Kenya | Republic | 38,610,097 | 47,564,296 |
Source: Kenya National Bureau of Statistics.
Further information about the population structure:
| Gender (C 2019) | |
|---|---|
| Males | 560,942 |
| Females | 594,609 |
| Intersex | 23 |
| Age Groups (C 2019) | |
|---|---|
| 0-14 years | 453,258 |
| 15-64 years | 657,677 |
| 65+ years | 44,589 |
| Age Distribution (C 2019) | |
|---|---|
| 90+ years | 1,381 |
| 80-89 years | 7,222 |
| 70-79 years | 19,419 |
| 60-69 years | 38,263 |
| 50-59 years | 52,613 |
| 40-49 years | 85,557 |
| 30-39 years | 153,081 |
| 20-29 years | 209,826 |
| 10-19 years | 299,427 |
| 0-9 years | 288,735 |