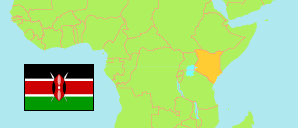
Busia
County in Kenya
Contents: Subdivision
The population development in Busia as well as related information and services (Wikipedia, Google, images).
| Name | Status | Population Census 2009-08-24 | Population Census 2019-08-24 | |
|---|---|---|---|---|
| Busia | County | 743,946 | 893,681 | |
| Bunyala | Subcounty | 66,723 | 85,977 | → |
| Busia | Subcounty | 111,345 | 142,408 | → |
| Butula | Subcounty | 121,870 | 140,334 | → |
| Nambale | Subcounty | 94,637 | 111,636 | → |
| Samia | Subcounty | 93,500 | 107,176 | → |
| Teso North | Subcounty | 117,947 | 138,034 | → |
| Teso South | Subcounty | 137,924 | 168,116 | → |
| Kenya | Republic | 38,610,097 | 47,564,296 |
Source: Kenya National Bureau of Statistics.
Further information about the population structure:
| Gender (C 2019) | |
|---|---|
| Males | 426,252 |
| Females | 467,401 |
| Intersex | 28 |
| Age Groups (C 2019) | |
|---|---|
| 0-14 years | 379,521 |
| 15-64 years | 475,800 |
| 65+ years | 38,323 |
| Age Distribution (C 2019) | |
|---|---|
| 90+ years | 1,477 |
| 80-89 years | 7,047 |
| 70-79 years | 16,583 |
| 60-69 years | 31,331 |
| 50-59 years | 46,619 |
| 40-49 years | 63,529 |
| 30-39 years | 94,898 |
| 20-29 years | 135,347 |
| 10-19 years | 256,226 |
| 0-9 years | 240,587 |
