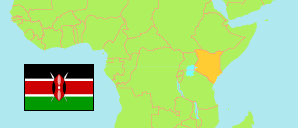
Bomet
County in Kenya
Contents: Subdivision
The population development in Bomet as well as related information and services (Wikipedia, Google, images).
| Name | Status | Population Census 2009-08-24 | Population Census 2019-08-24 | |
|---|---|---|---|---|
| Bomet | County | 730,129 | 875,689 | |
| Bomet Central | Subcounty | 136,537 | 175,215 | → |
| Bomet East | Subcounty | 119,641 | 144,275 | → |
| Chepalungu | Subcounty | 140,926 | 164,837 | → |
| Konoin (incl. Mau Forest) | Subcounty | 145,057 | 163,507 | → |
| Sotik | Subcounty | 187,968 | 227,855 | → |
| Kenya | Republic | 38,610,097 | 47,564,296 |
Source: Kenya National Bureau of Statistics.
Further information about the population structure:
| Gender (C 2019) | |
|---|---|
| Males | 434,287 |
| Females | 441,379 |
| Intersex | 23 |
| Age Groups (C 2019) | |
|---|---|
| 0-14 years | 364,784 |
| 15-64 years | 479,057 |
| 65+ years | 31,820 |
| Age Distribution (C 2019) | |
|---|---|
| 90+ years | 2,007 |
| 80-89 years | 5,825 |
| 70-79 years | 13,321 |
| 60-69 years | 24,793 |
| 50-59 years | 37,069 |
| 40-49 years | 68,552 |
| 30-39 years | 102,123 |
| 20-29 years | 147,178 |
| 10-19 years | 241,357 |
| 0-9 years | 233,436 |