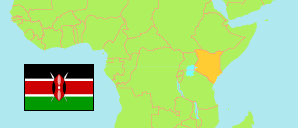
Kericho
County in Kenya
Contents: Subdivision
The population development in Kericho as well as related information and services (Wikipedia, Google, images).
| Name | Status | Population Census 2009-08-24 | Population Census 2019-08-24 | |
|---|---|---|---|---|
| Kericho | County | 752,396 | 901,777 | |
| Belgut | Subcounty | 136,229 | 145,072 | → |
| Bureti | Subcounty | 167,649 | 199,470 | → |
| Kericho East | Subcounty | 136,804 | 170,625 | → |
| Kipkelion | Subcounty | 89,442 | 122,530 | → |
| Londiani (incl. Mau Forest, Tinderet Forest) | Subcounty | 117,148 | 137,580 | → |
| Soin Sigowet | Subcounty | 105,124 | 126,500 | → |
| Kenya | Republic | 38,610,097 | 47,564,296 |
Source: Kenya National Bureau of Statistics.
Further information about the population structure:
| Gender (C 2019) | |
|---|---|
| Males | 450,741 |
| Females | 451,008 |
| Intersex | 28 |
| Age Groups (C 2019) | |
|---|---|
| 0-14 years | 354,800 |
| 15-64 years | 513,854 |
| 65+ years | 33,082 |
| Age Distribution (C 2019) | |
|---|---|
| 90+ years | 1,735 |
| 80-89 years | 5,667 |
| 70-79 years | 13,717 |
| 60-69 years | 27,700 |
| 50-59 years | 41,782 |
| 40-49 years | 75,168 |
| 30-39 years | 115,035 |
| 20-29 years | 158,942 |
| 10-19 years | 234,207 |
| 0-9 years | 227,783 |