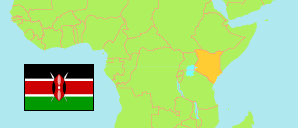
Nandi
County in Kenya
Contents: Subdivision
The population development in Nandi as well as related information and services (Wikipedia, Google, images).
| Name | Status | Population Census 2009-08-24 | Population Census 2019-08-24 | |
|---|---|---|---|---|
| Nandi | County | 752,965 | 885,711 | |
| Chesumei | Subcounty | 126,758 | 164,133 | → |
| Nandi Central | Subcounty | 134,078 | 147,553 | → |
| Nandi East | Subcounty | 107,534 | 119,173 | → |
| Nandi North | Subcounty | 134,648 | 166,171 | → |
| Nandi South | Subcounty | 149,256 | 172,750 | → |
| Tinderet | Subcounty | 100,691 | 115,931 | → |
| Kenya | Republic | 38,610,097 | 47,564,296 |
Source: Kenya National Bureau of Statistics.
Further information about the population structure:
| Gender (C 2019) | |
|---|---|
| Males | 441,259 |
| Females | 444,430 |
| Intersex | 22 |
| Age Groups (C 2019) | |
|---|---|
| 0-14 years | 348,217 |
| 15-64 years | 501,522 |
| 65+ years | 35,948 |
| Age Distribution (C 2019) | |
|---|---|
| 90+ years | 2,273 |
| 80-89 years | 6,011 |
| 70-79 years | 15,028 |
| 60-69 years | 28,684 |
| 50-59 years | 45,241 |
| 40-49 years | 75,501 |
| 30-39 years | 110,206 |
| 20-29 years | 145,785 |
| 10-19 years | 234,854 |
| 0-9 years | 222,104 |
