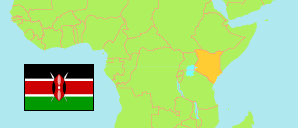
Nyandarua
County in Kenya
Contents: Subdivision
The population development in Nyandarua as well as related information and services (Wikipedia, Google, images).
| Name | Status | Population Census 2009-08-24 | Population Census 2019-08-24 | |
|---|---|---|---|---|
| Nyandarua | County | 596,268 | 638,289 | |
| Aberdare National Park | National Park | 0 | 15 | → |
| Kinangop | Subcounty | 104,982 | 111,410 | → |
| Kipipiri | Subcounty | 95,338 | 93,855 | → |
| Mirangine | Subcounty | 62,708 | 67,214 | → |
| Nyandarua Central | Subcounty | 67,392 | 75,262 | → |
| Nyandarua North | Subcounty | 92,626 | 98,698 | → |
| Nyandarua South | Subcounty | 87,397 | 93,870 | → |
| Nyandarua West | Subcounty | 85,825 | 97,965 | → |
| Kenya | Republic | 38,610,097 | 47,564,296 |
Source: Kenya National Bureau of Statistics.
Further information about the population structure:
| Gender (C 2019) | |
|---|---|
| Males | 315,022 |
| Females | 323,247 |
| Intersex | 20 |
| Age Groups (C 2019) | |
|---|---|
| 0-14 years | 227,764 |
| 15-64 years | 374,577 |
| 65+ years | 35,923 |
| Age Distribution (C 2019) | |
|---|---|
| 90+ years | 1,923 |
| 80-89 years | 6,289 |
| 70-79 years | 16,392 |
| 60-69 years | 25,371 |
| 50-59 years | 48,990 |
| 40-49 years | 67,323 |
| 30-39 years | 81,255 |
| 20-29 years | 87,389 |
| 10-19 years | 158,441 |
| 0-9 years | 144,891 |
