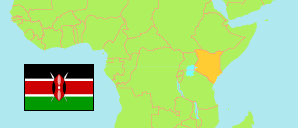
Makueni
County in Kenya
Contents: Subdivision
The population development in Makueni as well as related information and services (Wikipedia, Google, images).
| Name | Status | Population Census 2009-08-24 | Population Census 2019-08-24 | |
|---|---|---|---|---|
| Makueni | County | 884,527 | 987,653 | |
| Kathonzweni | Subcounty | 76,605 | 79,780 | → |
| Kibwezi | Subcounty | 178,402 | 197,000 | → |
| Kilungu | Subcounty | 60,601 | 60,952 | → |
| Makindu | Subcounty | 70,302 | 84,946 | → |
| Makueni | Subcounty | 102,780 | 130,375 | → |
| Mbooni East | Subcounty | 87,315 | 97,756 | → |
| Mbooni West | Subcounty | 97,309 | 102,594 | → |
| Mukaa | Subcounty | 87,864 | 107,549 | → |
| Nzaui | Subcounty | 123,349 | 126,701 | → |
| Kenya | Republic | 38,610,097 | 47,564,296 |
Source: Kenya National Bureau of Statistics.
Further information about the population structure:
| Gender (C 2019) | |
|---|---|
| Males | 489,691 |
| Females | 497,942 |
| Intersex | 20 |
| Age Groups (C 2019) | |
|---|---|
| 0-14 years | 344,220 |
| 15-64 years | 576,714 |
| 65+ years | 66,691 |
| Age Distribution (C 2019) | |
|---|---|
| 90+ years | 5,720 |
| 80-89 years | 11,572 |
| 70-79 years | 26,400 |
| 60-69 years | 49,823 |
| 50-59 years | 61,803 |
| 40-49 years | 96,783 |
| 30-39 years | 122,786 |
| 20-29 years | 145,659 |
| 10-19 years | 259,252 |
| 0-9 years | 207,827 |
