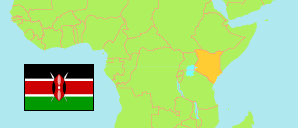
Kitui
County in Kenya
Contents: Subdivision
The population development in Kitui as well as related information and services (Wikipedia, Google, images).
| Name | Status | Population Census 2009-08-24 | Population Census 2019-08-24 | |
|---|---|---|---|---|
| Kitui | County | 1,012,709 | 1,136,187 | |
| Ikutha | Subcounty | 77,510 | 82,964 | → |
| Katulani | Subcounty | 45,141 | 47,108 | → |
| Kisasi | Subcounty | 43,588 | 46,142 | → |
| Kitui Central | Subcounty | 94,337 | 105,991 | → |
| Kitui West | Subcounty | 61,510 | 70,871 | → |
| Kyuso | Subcounty | 58,822 | 76,867 | → |
| Lower Yatta | Subcounty | 55,068 | 63,329 | → |
| Matinyani | Subcounty | 42,789 | 47,811 | → |
| Migwani | Subcounty | 63,570 | 79,255 | → |
| Mumoni | Subcounty | 34,225 | 29,344 | → |
| Mutitu | Subcounty | 49,871 | 55,287 | → |
| Mutitu North | Subcounty | 19,098 | 21,215 | → |
| Mutomo | Subcounty | 102,638 | 113,356 | → |
| Mwingi Central | Subcounty | 104,826 | 108,713 | → |
| Mwingi East | Subcounty | 76,585 | 85,139 | → |
| Nzambani | Subcounty | 36,211 | 46,788 | → |
| Thagicu | Subcounty | 13,084 | 15,136 | → |
| Tseikuru | Subcounty | 33,836 | 40,871 | → |
| Kenya | Republic | 38,610,097 | 47,564,296 |
Source: Kenya National Bureau of Statistics.
Further information about the population structure:
| Gender (C 2019) | |
|---|---|
| Males | 549,003 |
| Females | 587,151 |
| Intersex | 33 |
| Age Groups (C 2019) | |
|---|---|
| 0-14 years | 444,108 |
| 15-64 years | 620,269 |
| 65+ years | 71,767 |
| Age Distribution (C 2019) | |
|---|---|
| 90+ years | 5,769 |
| 80-89 years | 13,396 |
| 70-79 years | 29,975 |
| 60-69 years | 47,631 |
| 50-59 years | 63,523 |
| 40-49 years | 98,996 |
| 30-39 years | 125,369 |
| 20-29 years | 156,229 |
| 10-19 years | 324,594 |
| 0-9 years | 270,662 |