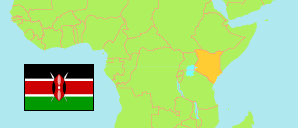
Marsabit
County in Kenya
Contents: Subdivision
The population development in Marsabit as well as related information and services (Wikipedia, Google, images).
| Name | Status | Population Census 2009-08-24 | Population Census 2019-08-24 | |
|---|---|---|---|---|
| Marsabit | County | 291,166 | 459,785 | |
| Loiyangalani | Subcounty | 26,111 | 35,713 | → |
| Marsabit Central | Subcounty | 46,502 | 79,181 | → |
| Marsabit North | Subcounty | 29,561 | 54,297 | → |
| Marsabit South | Subcounty | 39,558 | 65,376 | → |
| Moyale | Subcounty | 81,373 | 108,949 | → |
| North Horr | Subcounty | 45,635 | 71,447 | → |
| Sololo | Subcounty | 22,426 | 44,822 | → |
| Kenya | Republic | 38,610,097 | 47,564,296 |
Source: Kenya National Bureau of Statistics.
Further information about the population structure:
| Gender (C 2019) | |
|---|---|
| Males | 243,548 |
| Females | 216,219 |
| Intersex | 18 |
| Age Groups (C 2019) | |
|---|---|
| 0-14 years | 215,807 |
| 15-64 years | 230,067 |
| 65+ years | 13,887 |
| Age Distribution (C 2019) | |
|---|---|
| 90+ years | 910 |
| 80-89 years | 2,605 |
| 70-79 years | 6,359 |
| 60-69 years | 10,617 |
| 50-59 years | 16,624 |
| 40-49 years | 26,690 |
| 30-39 years | 45,285 |
| 20-29 years | 77,665 |
| 10-19 years | 128,630 |
| 0-9 years | 144,376 |