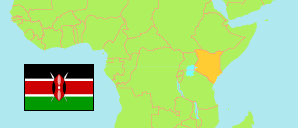
Mandera
County in Kenya
Contents: Subdivision
The population development in Mandera as well as related information and services (Wikipedia, Google, images).
| Name | Status | Population Census 2009-08-24 | Population Census 2019-08-24 | |
|---|---|---|---|---|
| Mandera | County | 1,025,756 | 867,457 | |
| Banisa | Subcounty | 158,074 | 152,598 | → |
| Kotulo | Subcounty | 70,329 | 72,394 | → |
| Lafey | Subcounty | 109,856 | 83,457 | → |
| Mandera Central | Subcounty | 203,937 | 157,220 | → |
| Mandera East | Subcounty | 178,831 | 159,638 | → |
| Mandera North | Subcounty | 143,028 | 143,850 | → |
| Mandera West | Subcounty | 161,701 | 98,300 | → |
| Kenya | Republic | 38,610,097 | 47,564,296 |
Source: Kenya National Bureau of Statistics.
Further information about the population structure:
| Gender (C 2019) | |
|---|---|
| Males | 434,976 |
| Females | 432,444 |
| Intersex | 37 |
| Age Groups (C 2019) | |
|---|---|
| 0-14 years | 475,723 |
| 15-64 years | 379,079 |
| 65+ years | 12,615 |
| Age Distribution (C 2019) | |
|---|---|
| 90+ years | 694 |
| 80-89 years | 2,520 |
| 70-79 years | 5,609 |
| 60-69 years | 11,634 |
| 50-59 years | 19,896 |
| 40-49 years | 41,675 |
| 30-39 years | 73,730 |
| 20-29 years | 127,592 |
| 10-19 years | 257,817 |
| 0-9 years | 326,250 |