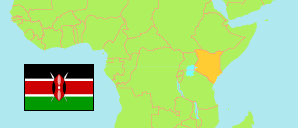
Garissa
County in Kenya
Contents: Subdivision
The population development in Garissa as well as related information and services (Wikipedia, Google, images).
| Name | Status | Population Census 2009-08-24 | Population Census 2019-08-24 | |
|---|---|---|---|---|
| Garissa | County | 623,060 | 841,353 | |
| Balambala | Subcounty | 62,390 | 32,257 | → |
| Dadaab | Subcounty | 152,487 | 185,252 | → |
| Fafi | Subcounty | 112,531 | 134,040 | → |
| Garissa | Subcounty | 127,672 | 163,914 | → |
| Hulugho | Subcounty | 28,959 | 133,984 | → |
| Ijara | Subcounty | 46,385 | 141,591 | → |
| Lagdera | Subcounty | 92,636 | 50,315 | → |
| Kenya | Republic | 38,610,097 | 47,564,296 |
Source: Kenya National Bureau of Statistics.
Further information about the population structure:
| Gender (C 2019) | |
|---|---|
| Males | 458,975 |
| Females | 382,344 |
| Intersex | 34 |
| Age Groups (C 2019) | |
|---|---|
| 0-14 years | 383,495 |
| 15-64 years | 443,437 |
| 65+ years | 14,382 |
| Age Distribution (C 2019) | |
|---|---|
| 90+ years | 714 |
| 80-89 years | 2,564 |
| 70-79 years | 6,307 |
| 60-69 years | 14,217 |
| 50-59 years | 26,735 |
| 40-49 years | 51,655 |
| 30-39 years | 89,191 |
| 20-29 years | 148,341 |
| 10-19 years | 254,758 |
| 0-9 years | 246,832 |