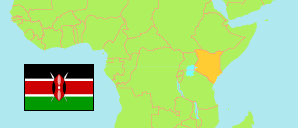
Kilifi
County in Kenya
Contents: Subdivision
The population development in Kilifi as well as related information and services (Wikipedia, Google, images).
| Name | Status | Population Census 2009-08-24 | Population Census 2019-08-24 | |
|---|---|---|---|---|
| Kilifi | County | 1,109,735 | 1,453,787 | |
| Chonyi | Subcounty | 56,304 | 62,335 | → |
| Ganze | Subcounty | 117,074 | 143,906 | → |
| Kaloleni | Subcounty | 155,739 | 193,682 | → |
| Kauma | Subcounty | 13,676 | 22,638 | → |
| Kilifi North | Subcounty | 126,019 | 178,824 | → |
| Kilifi South | Subcounty | 143,224 | 206,753 | → |
| Magarini | Subcounty | 151,159 | 191,610 | → |
| Malindi | Subcounty | 249,355 | 333,226 | → |
| Rabai | Subcounty | 97,185 | 120,813 | → |
| Kenya | Republic | 38,610,097 | 47,564,296 |
Source: Kenya National Bureau of Statistics.
Further information about the population structure:
| Gender (C 2019) | |
|---|---|
| Males | 704,089 |
| Females | 749,673 |
| Intersex | 25 |
| Age Groups (C 2019) | |
|---|---|
| 0-14 years | 613,788 |
| 15-64 years | 784,069 |
| 65+ years | 55,888 |
| Age Distribution (C 2019) | |
|---|---|
| 90+ years | 2,188 |
| 80-89 years | 8,338 |
| 70-79 years | 24,027 |
| 60-69 years | 50,929 |
| 50-59 years | 66,087 |
| 40-49 years | 109,612 |
| 30-39 years | 159,175 |
| 20-29 years | 247,251 |
| 10-19 years | 379,122 |
| 0-9 years | 407,016 |
