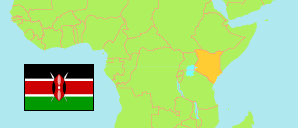
Mombasa
County in Kenya
Contents: Subdivision
The population development in Mombasa as well as related information and services (Wikipedia, Google, images).
| Name | Status | Population Census 2009-08-24 | Population Census 2019-08-24 | |
|---|---|---|---|---|
| Mombasa | County | 939,370 | 1,208,333 | |
| Changamwe | Subcounty | 132,692 | 131,882 | → |
| Jomvu | Subcounty | 117,487 | 163,415 | → |
| Kisauni | Subcounty | 273,875 | 291,930 | → |
| Likoni | Subcounty | 166,008 | 250,358 | → |
| Mvita | Subcounty | 143,128 | 154,171 | → |
| Nyali | Subcounty | 106,180 | 216,577 | → |
| Kenya | Republic | 38,610,097 | 47,564,296 |
Source: Kenya National Bureau of Statistics.
Further information about the population structure:
| Gender (C 2019) | |
|---|---|
| Males | 610,257 |
| Females | 598,046 |
| Intersex | 30 |
| Age Groups (C 2019) | |
|---|---|
| 0-14 years | 393,313 |
| 15-64 years | 792,072 |
| 65+ years | 22,892 |
| Age Distribution (C 2019) | |
|---|---|
| 90+ years | 548 |
| 80-89 years | 2,661 |
| 70-79 years | 9,440 |
| 60-69 years | 26,277 |
| 50-59 years | 57,529 |
| 40-49 years | 124,085 |
| 30-39 years | 211,330 |
| 20-29 years | 282,361 |
| 10-19 years | 216,157 |
| 0-9 years | 277,889 |
