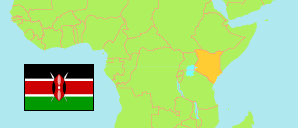
Samburu
County in Kenya
Contents: Population
The population development of Samburu as well as related information and services (Wikipedia, Google, images).
| Name | Status | Population Census 1979-08-24 | Population Census 1989-08-24 | Population Census 1999-08-24 | Population Census 2009-08-24 | Population Census 2019-08-24 | Population Projection 2023-07-01 | |
|---|---|---|---|---|---|---|---|---|
| Samburu | County | 76,908 | 108,884 | 143,547 | 223,947 | 310,327 | 348,298 | |
| Kenya | Republic | 15,327,061 | 21,443,636 | 28,686,607 | 38,610,097 | 47,564,296 | 51,525,602 |
Source: Kenya National Bureau of Statistics.
Further information about the population structure:
| Gender (P 2023) | |
|---|---|
| Males | 172,362 |
| Females | 175,936 |
| Age Groups (P 2023) | |
|---|---|
| 0-14 years | 160,179 |
| 15-64 years | 178,078 |
| 65+ years | 10,041 |
| Age Distribution (P 2023) | |
|---|---|
| 80+ years | 2,757 |
| 70-79 years | 4,506 |
| 60-69 years | 6,010 |
| 50-59 years | 9,940 |
| 40-49 years | 18,090 |
| 30-39 years | 35,165 |
| 20-29 years | 66,000 |
| 10-19 years | 96,158 |
| 0-9 years | 109,672 |
| Urbanization (C 2019) | |
|---|---|
| Rural | 263,195 |
| Urban | 47,132 |
| Religion (C 2019) | |
|---|---|
| Catholic s | 176,566 |
| Protestants | 54,349 |
| Evangelicals | 18,339 |
| Other Christians | 11,280 |
| Muslims | 2,849 |
| Hindus | 71 |
| Traditional religion | 30,433 |
| Other religion | 4,686 |
| No Religion | 7,428 |