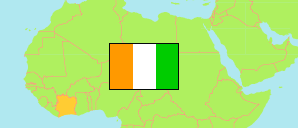
Abidjan
Autonomous District in Ivory Coast
Contents: Subdivision
The population development in Abidjan as well as related information and services (Wikipedia, Google, images).
| Name | Status | Population Census 2014-05-15 | Population Census 2021-12-14 | |
|---|---|---|---|---|
| Abidjan | Autonomous District | 4,707,404 | 6,321,017 | |
| Abidjan | Sub-Prefecture | 4,395,243 | 5,616,633 | → |
| Anyama | Sub-Prefecture | 148,962 | 389,592 | → |
| Bingerville | Sub-Prefecture | 91,319 | 204,656 | → |
| Brofodoumé | Sub-Prefecture | 15,842 | 20,357 | → |
| Songon | Sub-Prefecture | 56,038 | 89,778 | → |
| Côte d'Ivoire [Ivory Coast] | Republic | 22,671,331 | 29,389,150 |
Source: Institut National de la Statistique, Republique de Côte d'Ivoire (web).
Explanation: Area figures are derived from geospatial data.