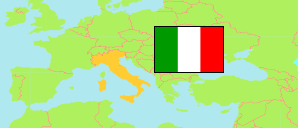
Castelcovati (Italy)
Contents: Urban Area
The population development of Castelcovati as well as related information and services (weather, Wikipedia, Google, images).
| Name | Region(s) | Population Census 2011-10-09 | Population Census 2021-12-31 | Population Estimate 2025-01-01 | |
|---|---|---|---|---|---|
| Castelcovati | Lombardia | 6,224 | 6,638 | 6,900 | → |
Source: Istituto Nazionale di Statistica Italia.
Explanation: The urban areas are composed by »City Population« using localities according to their final 2021 definition. A maximum connection distance of 500m to 1000m between the localities holds (depending on the population size). Area figures are calculated by geospatial data.
Further information about the population structure:
| Gender (C 2021) | |
|---|---|
| Males | 3,377 |
| Females | 3,261 |
| Age Groups (C 2021) | |
|---|---|
| 0-14 years | 1,124 |
| 15-64 years | 4,390 |
| 65+ years | 1,124 |
| Age Distribution (C 2021) | |
|---|---|
| 70+ years | 797 |
| 60-69 years | 713 |
| 50-59 years | 886 |
| 40-49 years | 1,030 |
| 30-39 years | 898 |
| 20-29 years | 812 |
| 10-19 years | 763 |
| 0-9 years | 739 |
| Citizenship (C 2021) | |
|---|---|
| Italy | 5,245 |
| European Union | 185 |
| Other Citizenship | 1,208 |