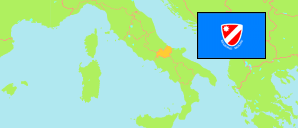
Provinces
The population of the provinces of Molise according to census results and latest official estimates.
| Name | Abbr. | Status | Capital | Area A (km²) | Population Census (C) 1981-10-25 | Population Census (C) 1991-10-20 | Population Census (C) 2001-10-21 | Population Census (C) 2011-10-09 | Population Estimate (E) 2022-01-01 | Population Estimate (Ep) 2024-01-01 | ||
|---|---|---|---|---|---|---|---|---|---|---|---|---|
| Campobasso | Prov | Campobasso | 2,925 | 235,847 | 238,958 | 230,749 | 226,419 | 211,586 | 210,028 | 292500 | → | |
| Isernia | Prov | Isernia | 1,535 | 92,524 | 91,942 | 89,852 | 87,241 | 80,564 | 79,385 | 153500 | → | |
| Molise | MOL | Reg | Campobasso | 4,460 | 328,371 | 330,900 | 320,601 | 313,660 | 292,150 | 289,413 | 446000 | → |
| Italy | ITA | Rep | Roma | 302,068 | 56,556,911 | 56,778,031 | 56,995,744 | 59,433,744 | 59,030,133 | 58,989,749 | → |
- Tabulated population estimates are result of a sampling survey combined with an evaluation of registers.
- Istituto Nazionale di Statistica Italia.
Major Cities
| Name | Population Estimate (Ep) 2024-01-01 | |
|---|---|---|
| 1 | Campobasso | 47,449 |
| 2 | Termoli | 31,980 |
| 3 | Isernia | 20,731 |
Contents: Cities & Communes
The population of all cities and communes in Molise with more than 5,000 inhabitants according to census results and latest official estimates.
| Name | Population Census (C) 1981-10-25 | Population Census (C) 1991-10-20 | Population Census (C) 2001-10-21 | Population Census (C) 2011-10-09 | Population Estimate (E) 2022-01-01 | Population Estimate (Ep) 2024-01-01 | Area | |
|---|---|---|---|---|---|---|---|---|
| Agnone | 6,324 | 6,207 | 5,842 | 5,240 | 4,703 | 4,651 | 9685 | → |
| Bojano | 7,260 | 8,426 | 8,312 | 7,946 | 7,502 | 7,537 | 5263 | → |
| Campobasso | 48,291 | 50,941 | 50,762 | 48,747 | 47,587 | 47,449 | 5611 | → |
| Campomarino | 5,482 | 5,818 | 6,310 | 7,068 | 7,648 | 7,867 | 7668 | → |
| Guglionesi | 5,758 | 5,464 | 5,156 | 5,449 | 4,926 | 4,865 | 10095 | → |
| Isernia | 20,145 | 20,933 | 21,152 | 22,025 | 20,748 | 20,731 | 6915 | → |
| Larino | 7,805 | 8,294 | 7,078 | 7,142 | 6,409 | 6,334 | 8877 | → |
| Montenero di Bisaccia | 7,310 | 7,137 | 6,698 | 6,649 | 6,191 | 6,237 | 9331 | → |
| Riccia | 6,232 | 6,176 | 5,701 | 5,403 | 4,901 | 4,791 | 7004 | → |
| Termoli | 22,849 | 28,552 | 30,255 | 32,793 | 32,391 | 31,980 | 5563 | → |
| Venafro | 8,791 | 10,107 | 11,198 | 11,236 | 11,006 | 10,786 | 4645 | → |
- Tabulated population estimates are result of a sampling survey combined with an evaluation of registers.
- Istituto Nazionale di Statistica Italia.
Population Structure
Further information about the population structure.
| Gender (E 2024) | |
|---|---|
| Males | 143,437 |
| Females | 145,976 |
| Age Groups (E 2024) | |
|---|---|
| 0-17 years | 38,321 |
| 18-64 years | 173,817 |
| 65+ years | 77,275 |
| Age Distribution (E 2024) | |
|---|---|
| 90+ years | 5,230 |
| 80-89 years | 19,181 |
| 70-79 years | 32,749 |
| 60-69 years | 42,418 |
| 50-59 years | 46,036 |
| 40-49 years | 38,055 |
| 30-39 years | 32,472 |
| 20-29 years | 29,653 |
| 10-19 years | 24,453 |
| 0-9 years | 19,166 |
| Citizenship (E 2024) | |
|---|---|
| Italy | 275,640 |
| Foreign Citizenship | 13,773 |
