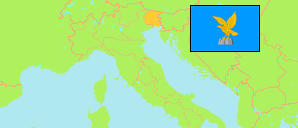
Provinces
The population of the provinces of Friuli-Venezia Giulia according to census results and latest official estimates.
| Name | Abbr. | Status | Capital | Area A (km²) | Population Census (C) 1981-10-25 | Population Census (C) 1991-10-20 | Population Census (C) 2001-10-21 | Population Census (C) 2011-10-09 | Population Evaluation (R) 2022-01-01 | Population Evaluation (Rp) 2024-01-01 | ||
|---|---|---|---|---|---|---|---|---|---|---|---|---|
| Gorizia | Prov | Gorizia | 475 | 144,726 | 138,119 | 136,491 | 140,143 | 137,899 | 138,430 | 47500 | → | |
| Pordenone | Prov | Pordenone | 2,275 | 275,888 | 275,267 | 286,198 | 310,811 | 309,473 | 311,149 | 227500 | → | |
| Trieste | Prov | Trieste | 212 | 283,641 | 261,825 | 242,235 | 232,601 | 228,833 | 228,952 | 21200 | → | |
| Udine | Prov | Udine | 4,969 | 531,108 | 523,828 | 520,199 | 536,736 | 518,442 | 517,261 | 496900 | → | |
| Friuli-Venezia Giulia | FRI | AReg | Trieste | 7,932 | 1,235,363 | 1,199,039 | 1,185,123 | 1,220,291 | 1,194,647 | 1,195,792 | 793200 | → |
| Italy | ITA | Rep | Roma | 302,068 | 56,556,911 | 56,778,031 | 56,995,744 | 59,433,744 | 59,030,133 | 58,989,749 | → |
- Population figures for 2022 and later are result of a sampling survey combined with an evaluation of registers.
- Istituto Nazionale di Statistica Italia.
Major Cities
| Name | Population Evaluation (Rp) 2024-01-01 | |
|---|---|---|
| 1 | Trieste | 199,400 |
| 2 | Udine | 98,430 |
| 3 | Pordenone | 52,344 |
Contents: Cities & Communes
The population of all cities and communes in Friuli-Venezia Giulia with more than 15,000 inhabitants according to census results and latest official estimates.
| Name | Population Census (C) 1981-10-25 | Population Census (C) 1991-10-20 | Population Census (C) 2001-10-21 | Population Census (C) 2011-10-09 | Population Evaluation (R) 2022-01-01 | Population Evaluation (Rp) 2024-01-01 | Area | |
|---|---|---|---|---|---|---|---|---|
| Azzano Decimo | 11,516 | 11,949 | 12,880 | 15,554 | 15,660 | 15,750 | 5134 | → |
| Codroipo | 14,257 | 14,234 | 14,421 | 15,806 | 15,877 | 15,906 | 7520 | → |
| Cordenons | 14,613 | 15,485 | 16,991 | 18,203 | 17,886 | 17,829 | 5634 | → |
| Gorizia | 41,557 | 38,505 | 35,667 | 35,212 | 33,615 | 33,728 | 4126 | → |
| Monfalcone | 30,259 | 27,223 | 26,393 | 27,041 | 29,072 | 30,103 | 2064 | → |
| Porcia | 13,143 | 13,086 | 13,616 | 15,251 | 14,985 | 14,945 | 2953 | → |
| Pordenone | 52,094 | 50,192 | 49,122 | 50,583 | 51,617 | 52,344 | 3821 | → |
| Sacile | 16,542 | 16,759 | 18,215 | 19,897 | 19,877 | 20,047 | 3274 | → |
| San Vito al Tagliamento | 12,013 | 12,511 | 13,316 | 15,011 | 15,097 | 15,231 | 6088 | → |
| Tavagnacco | 10,323 | 11,430 | 12,374 | 14,262 | 14,730 | 14,629 | 1534 | → |
| Trieste | 252,369 | 231,100 | 211,184 | 202,123 | 199,015 | 199,400 | 8510 | → |
| Udine | 102,021 | 99,189 | 95,030 | 98,287 | 97,736 | 98,430 | 5719 | → |
- Population figures for 2022 and later are result of a sampling survey combined with an evaluation of registers.
- Istituto Nazionale di Statistica Italia.
Population Structure
Further information about the population structure.
| Gender (R 2024) | |
|---|---|
| Males | 584,434 |
| Females | 611,358 |
| Age Groups (R 2024) | |
|---|---|
| 0-17 years | 165,837 |
| 18-64 years | 705,598 |
| 65+ years | 324,357 |
| Age Distribution (R 2024) | |
|---|---|
| 90+ years | 20,459 |
| 80-89 years | 89,907 |
| 70-79 years | 138,028 |
| 60-69 years | 166,219 |
| 50-59 years | 200,782 |
| 40-49 years | 156,200 |
| 30-39 years | 122,867 |
| 20-29 years | 113,594 |
| 10-19 years | 106,140 |
| 0-9 years | 81,596 |
| Citizenship (R 2024) | |
|---|---|
| Italy | 1,074,270 |
| Foreign Citizenship | 121,522 |
