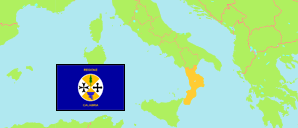
Provinces
The population of the provinces of Calabria according to census results and latest official estimates.
| Name | Abbr. | Status | Capital | Area A (km²) | Population Census (C) 1981-10-25 | Population Census (C) 1991-10-20 | Population Census (C) 2001-10-21 | Population Census (C) 2011-10-09 | Population Evaluation (R) 2022-01-01 | Population Evaluation (Rp) 2024-01-01 | ||
|---|---|---|---|---|---|---|---|---|---|---|---|---|
| Catanzaro | Prov | Catanzaro | 2,415 | 381,797 | 382,565 | 369,578 | 359,841 | 343,673 | 340,642 | 241500 | → | |
| Cosenza | Prov | Cosenza | 6,710 | 743,255 | 750,896 | 733,797 | 714,030 | 674,543 | 670,165 | 671000 | → | |
| Crotone | Prov | Crotone | 1,736 | 186,671 | 180,409 | 173,122 | 170,803 | 163,553 | 161,733 | 173600 | → | |
| Reggio Calabria | MetProv | Reggio di Calabria | 3,210 | 573,093 | 576,693 | 564,223 | 550,967 | 522,127 | 515,046 | 321000 | → | |
| Vibo Valentia | Prov | Vibo Valentia | 1,151 | 176,366 | 179,640 | 170,746 | 163,409 | 151,558 | 150,564 | 115100 | → | |
| Calabria | CAL | Reg | Catanzaro | 15,222 | 2,061,182 | 2,070,203 | 2,011,466 | 1,959,050 | 1,855,454 | 1,838,150 | 1522200 | → |
| Italy | ITA | Rep | Roma | 302,068 | 56,556,911 | 56,778,031 | 56,995,744 | 59,433,744 | 59,030,133 | 58,989,749 | → |
- Population figures for 2022 and later are result of a sampling survey combined with an evaluation of registers.
- Istituto Nazionale di Statistica Italia.
Major Cities
| Name | Population Evaluation (Rp) 2024-01-01 | |
|---|---|---|
| 1 | Reggio di Calabria | 169,795 |
| 2 | Catanzaro | 84,115 |
| 3 | Corigliano-Rossano | 74,091 |
| 4 | Lamezia Terme | 67,211 |
| 5 | Cosenza | 63,693 |
| 6 | Crotone | 58,294 |
| 7 | Rende | 36,657 |
| 8 | Vibo Valentia | 31,032 |
Contents: Cities & Communes
The population of all cities and communes in Calabria with more than 20,000 inhabitants according to census results and latest official estimates.
| Name | Population Census (C) 1981-10-25 | Population Census (C) 1991-10-20 | Population Census (C) 2001-10-21 | Population Census (C) 2011-10-09 | Population Evaluation (R) 2022-01-01 | Population Evaluation (Rp) 2024-01-01 | Area | |
|---|---|---|---|---|---|---|---|---|
| Acri | 21,189 | 22,223 | 21,891 | 21,458 | 19,127 | 18,574 | 20063 | → |
| Castrovillari | 20,452 | 23,249 | 22,389 | 22,515 | 20,932 | 20,643 | 13064 | → |
| Catanzaro | 100,832 | 96,614 | 95,251 | 89,364 | 85,609 | 84,115 | 11272 | → |
| Corigliano-Rossano | 66,278 | 69,309 | 74,076 | 74,848 | 74,173 | 74,091 | 34655 | → |
| Cosenza | 106,801 | 86,664 | 72,998 | 69,484 | 64,073 | 63,693 | 3786 | → |
| Crotone | 58,262 | 59,001 | 60,010 | 58,881 | 59,359 | 58,294 | 18199 | → |
| Gioia Tauro | 17,488 | 18,484 | 17,762 | 19,063 | 19,254 | 19,236 | 3987 | → |
| Lamezia Terme (Nicastro) | 63,989 | 70,114 | 70,501 | 70,336 | 67,413 | 67,211 | 16243 | → |
| Montalto Uffugo | 11,939 | 15,093 | 17,382 | 18,168 | 20,159 | 20,087 | 7667 | → |
| Reggio di Calabria | 173,486 | 177,580 | 180,353 | 180,817 | 172,479 | 169,795 | 23904 | → |
| Rende | 25,281 | 30,946 | 34,421 | 33,555 | 36,123 | 36,657 | 5528 | → |
| Vibo Valentia | 31,516 | 34,836 | 33,957 | 33,357 | 31,480 | 31,032 | 4657 | → |
- Population figures for 2022 and later are result of a sampling survey combined with an evaluation of registers.
- Istituto Nazionale di Statistica Italia.
Population Structure
Further information about the population structure.
| Gender (R 2024) | |
|---|---|
| Males | 900,851 |
| Females | 937,299 |
| Age Groups (R 2024) | |
|---|---|
| 0-17 years | 287,279 |
| 18-64 years | 1,111,254 |
| 65+ years | 439,617 |
| Age Distribution (R 2024) | |
|---|---|
| 90+ years | 25,520 |
| 80-89 years | 102,795 |
| 70-79 years | 190,820 |
| 60-69 years | 256,512 |
| 50-59 years | 279,485 |
| 40-49 years | 246,722 |
| 30-39 years | 217,272 |
| 20-29 years | 194,008 |
| 10-19 years | 177,679 |
| 0-9 years | 147,337 |
| Citizenship (R 2024) | |
|---|---|
| Italy | 1,735,737 |
| Foreign Citizenship | 102,413 |
