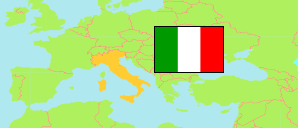
Viterbo
Province in Italy
Contents: Population
The population development of Viterbo as well as related information and services (Wikipedia, Google, images).
| Name | Status | Population Census 1981-10-25 | Population Census 1991-10-20 | Population Census 2001-10-21 | Population Census 2011-10-09 | Population Census 2021-12-31 | Population Estimate 2025-01-01 | |
|---|---|---|---|---|---|---|---|---|
| Viterbo | Province | 268,448 | 278,521 | 288,783 | 312,864 | 308,737 | 307,430 | |
| Italia [Italy] | Republic | 56,556,911 | 56,778,031 | 56,995,744 | 59,433,744 | 59,030,133 | 58,934,177 |
Source: Istituto Nazionale di Statistica Italia.
Explanation: The 2025 figures are preliminary.
Further information about the population structure:
| Gender (E 2025) | |
|---|---|
| Males | 151,772 |
| Females | 155,658 |
| Age Groups (E 2025) | |
|---|---|
| 0-17 years | 41,837 |
| 18-64 years | 185,005 |
| 65+ years | 80,588 |
| Age Distribution (E 2025) | |
|---|---|
| 90+ years | 4,347 |
| 80-89 years | 19,599 |
| 70-79 years | 35,608 |
| 60-69 years | 45,018 |
| 50-59 years | 50,772 |
| 40-49 years | 42,535 |
| 30-39 years | 33,016 |
| 20-29 years | 29,027 |
| 10-19 years | 27,370 |
| 0-9 years | 20,138 |
| Citizenship (E 2025) | |
|---|---|
| Italy | 274,651 |
| Foreign Citizenship | 32,779 |
